Bass vs. Halibut — Health Impact and Nutrition Comparison


Summary
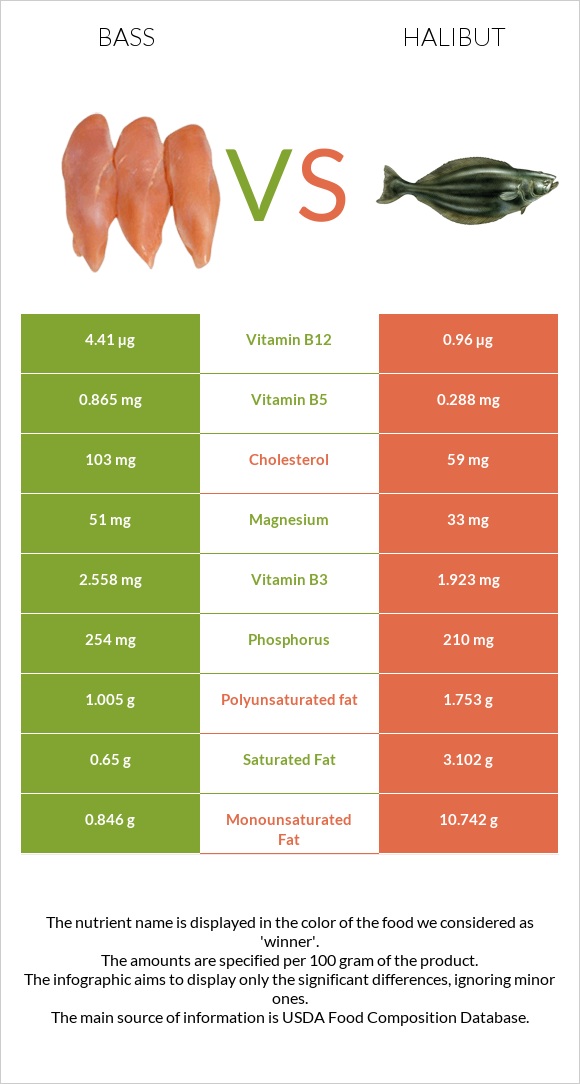
Bass is higher in protein, calcium, and vitamin B12. Bass provides 44g more cholesterol than halibut. Halibut is richer in fats, especially in monounsaturated fats. It has a lower water content. Due to its higher fat content, halibut provides 115 more calories than bass.
Table of contents
Introduction
Two of the world's most popular and affordable fish are halibut and Asian sea bass. The nutritional content, health implications, and actual differences between these fish species will all be compared in this article. Take the time to look at the infographics below to see how the various nutrients are distributed visually.
Actual differences
Halibut and bass are two famous fish species. Asian sea bass is a type of white fish that lives in salty environments. Halibut is a species of flatfish. The flavors, aromas, textures, and appearances of these species differ.
Basses frequently range from dark brown to grayish black, with the belly being noticeably lighter, while halibuts have a diamond-shaped body from grey to dark brown.
Bass has a delicate, sweet, nut-like flavor, while halibut tastes sweet and subtle. Bass usually does not smell fishy. In contrast, good-quality halibut has a sea-fresh aroma.
The texture of the bass is strong and meaty, while halibut has a firm and dense texture.
Nutrition
This section will compare 100g of cooked and dried halibut and bass's macronutrients, mineral, and vitamin compositions. Neither halibut nor bass contains any amounts of carbs.
Bass contains 73% of water per 100g, while the same amount of halibut has 62% of water. The fat content is the most visible difference in the chart below: halibut is significantly richer in fats. See the details in the corresponding sections.
Macronutrient Comparison
Protein
Bass is higher in protein than halibut. Per 100g serving, the bass provides 22.7g of protein, while halibut contains 18.4g of it.
Both contain essential amino acids, such as phenylalanine, histidine, and lysine.
Fat
Halibut is six times higher in fats than bass. Halibut contains 17.4g of fats per 100g, while the same serving of bass provides 3g of them. Halibut is notably richer in monounsaturated fats, having 10g more of them than bass.
It is also higher in polyunsaturated and saturated fats.
Bass is 44mg higher in cholesterol than halibut.
Fat Type Comparison
Calories
Halibut and bass are classified as medium-calorie foods. Due to its higher fat composition, halibut has more calories than bass. It provides 115 more calories per 100g serving.
Minerals
The absolute leader in this section is bass.
Bass provides more calcium, iron, magnesium, phosphorus, and manganese than halibut. Halibut contains more sodium and potassium.
100g of bass covers 109% of the DV for phosphorus.
You can check the mineral comparison chart shown below.
Mineral Comparison
Vitamins
In general, the bass has a higher vitamin content. It is richer in nearly all the vitamins. Halibut is higher in vitamins B2 and B6. Bass covers 552% of the DV of vitamin B12, while halibut covers only 120% of it.
Vitamin Comparison
Health impact
Similarities
Bass and halibut have a similar effect on cardiovascular health.
Consuming bass and halibut is associated with a decreased risk of cardiovascular disease (1).
This results from the balance of omega-3 and omega-6 fatty acids. These two substances are long-chain essential fatty acids, which the human body is unable to produce. As a result, we must obtain them through what we eat. According to research, the risk of heart disease rises when the ratio of omega-3 to omega-6 fatty acid concentrations in blood flow is not in balance (2). For people with greater blood levels of omega-6, eating halibut and bass increases their blood levels of omega-3 (3) (4).
References

Infographic
Comparison summary table
|
|
||
| Lower in Cholesterol |
|
||
| Lower in Sodium |
|
||
| Lower in Saturated Fat |
|
||
| Lower in price |
|
||
| Rich in minerals |
|
||
| Rich in vitamins |
|
||
| Lower in Sugar | Equal | ||
| Lower in Glycemic Index | Equal | ||
All nutrients comparison - raw data values
| Nutrient | |
|
Opinion |
| Protein | 22.73g | 18.42g |
|
| Fats | 2.99g | 17.74g |
|
| Calories | 124kcal | 239kcal |
|
| Calcium | 19mg | 4mg |
|
| Iron | 1.08mg | 0.85mg |
|
| Magnesium | 51mg | 33mg |
|
| Phosphorus | 254mg | 210mg |
|
| Potassium | 328mg | 344mg |
|
| Sodium | 88mg | 103mg |
|
| Zinc | 0.51mg | 0.51mg | |
| Copper | 0.04mg | 0.038mg |
|
| Manganese | 0.019mg | 0.015mg |
|
| Selenium | 46.8µg | 46.8µg | |
| Vitamin A | 104IU | 60IU |
|
| Vitamin A RAE | 31µg | 18µg |
|
| Vitamin B1 | 0.115mg | 0.073mg |
|
| Vitamin B2 | 0.037mg | 0.103mg |
|
| Vitamin B3 | 2.558mg | 1.923mg |
|
| Vitamin B5 | 0.865mg | 0.288mg |
|
| Vitamin B6 | 0.346mg | 0.485mg |
|
| Folate | 10µg | 1µg |
|
| Vitamin B12 | 4.41µg | 0.96µg |
|
| Tryptophan | 0.255mg | 0.206mg |
|
| Threonine | 0.997mg | 0.808mg |
|
| Isoleucine | 1.047mg | 0.849mg |
|
| Leucine | 1.848mg | 1.497mg |
|
| Lysine | 2.088mg | 1.692mg |
|
| Methionine | 0.673mg | 0.545mg |
|
| Phenylalanine | 0.887mg | 0.719mg |
|
| Valine | 1.171mg | 0.949mg |
|
| Histidine | 0.669mg | 0.542mg |
|
| Cholesterol | 103mg | 59mg |
|
| Saturated Fat | 0.65g | 3.102g |
|
| Omega-3 - DHA | 0.75g | 0.504g |
|
| Omega-3 - EPA | 0.217g | 0.674g |
|
| Omega-3 - DPA | 0.114g |
|
|
| Monounsaturated Fat | 0.846g | 10.742g |
|
| Polyunsaturated fat | 1.005g | 1.753g |
|
Which food is preferable for your diet?
|
|
|
| Low Fats diet |
|
|
| Low Carbs diet | Equal | |
| Low Calories diet |
|
|
| Low Glycemic Index diet | Equal | |
People also compare


Vitamins & Minerals Daily Need Coverage Score
Comparison summary
References
All the values for which the sources are not specified explicitly are taken from FDA’s Food Central. The exact link to the food presented on this page can be found below.
- Bass - https://fdc.nal.usda.gov/fdc-app.html#/food-details/174228/nutrients
- Halibut - https://fdc.nal.usda.gov/fdc-app.html#/food-details/174232/nutrients
All the Daily Values are presented for males aged 31-50, for 2000-calorie diets.