Salmon vs. Tuna — Nutrition and Health Impact Comparison


Summary
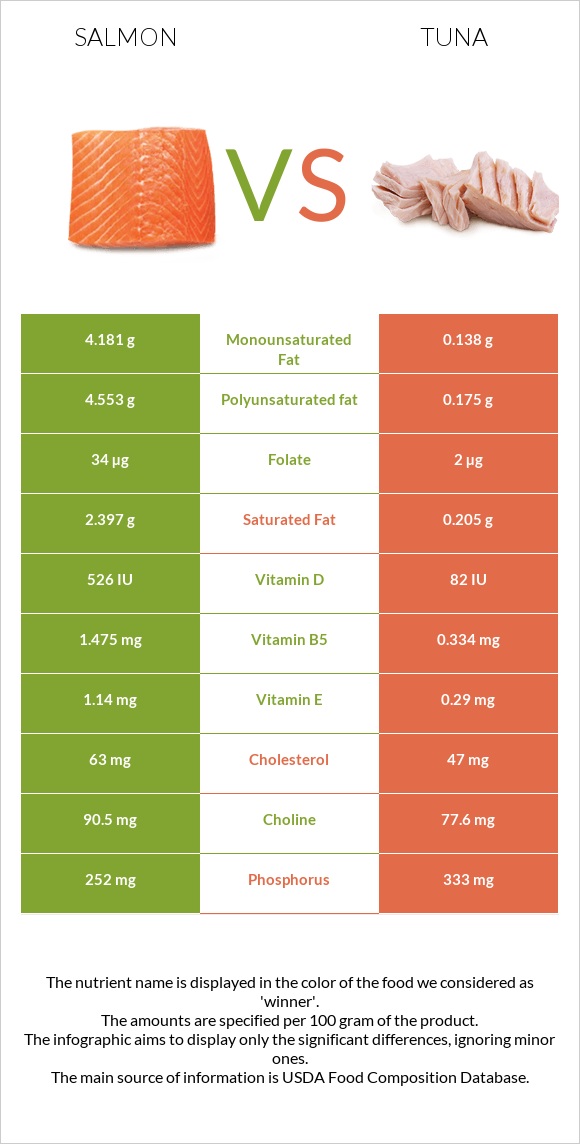
Tuna is higher in protein, while salmon is 21 times richer in fats, particularly the polyunsaturated omega-3 fatty acids, and overall higher in calories. Salmon is also higher in cholesterol.
Salmon provides 17 times more folate (vitamin B9) and is a good source of vitamin C, unlike tuna. Then again, tuna is a better source of minerals such as magnesium, phosphorus, potassium, iron, selenium, and zinc.
Tuna and salmon can have various beneficial effects on health when consumed in moderation.
Table of contents
Introduction
Salmon and tuna are two of the most widely consumed fish in the world. Growing in similar conditions, the nutrition composition of these fishes can be very similar. However, in this article, we will also discuss the dissimilarities between salmon and tuna and what impacts these differences have on health.
Nutrition
The nutritional values below are presented for farmed Atlantic salmon and fresh bluefin tuna cooked by dry heating.
Macronutrients and Calories
Overall, salmon and tuna have similar nutritional densities, salmon being only a little denser. Salmon comprises 65% water and 35% nutrients, while tuna contains 69% water.
Macronutrient Comparison
Salmon and tuna also have the same average serving size of three ounces, equal to 85 grams.
Calories
Salmon is somewhat higher in calories, providing 206 calories per 100g serving, while tuna contains 130 calories.
Protein
While both these fish are great sources of proteins, tuna is richer in this macronutrient. One hundred-gram serving of salmon contains nearly 22g of protein, whereas an equal amount of tuna has about 29g of protein.
Interestingly enough, raw tuna and salmon are much more similar in their macronutrient compositions, containing nearly the same amounts of protein (2, 3).
The quality of protein found in salmon and tuna is excellent, as they both contain high amounts of all essential amino acids.
Fats
When looking at the fat compositions of these two, salmon is almost 21 times higher in fats but has a somewhat more favorable fat composition. While the predominant fats found in salmon and tuna are polyunsaturated and monounsaturated fatty acids, tuna has a slightly higher percentage of saturated fats.
Fat Type Comparison
That being said, being lower in fats overall, tuna contains fewer grams of saturated fats.
Salmon contains more cholesterol. One hundred-gram serving of salmon contains 63mg of cholesterol, while the same amount of tuna has 47mg of cholesterol.
Carbohydrates
Both tuna and salmon do not contain a notable amount of carbohydrates.
Vitamins
Salmon and tuna are both rich in various vitamins.
Salmon provides 17 times more folate or vitamin B9 and richer in vitamins A, D, E, B1, B5, and B12. Salmon also falls in the top 32% of foods as a source of vitamin C, which tuna lacks entirely.
Conversely, tuna is a better source of vitamins B2, B3, and B6.
Salmon and tuna contain a similar level of vitamin K.
Consuming 100g of these fish can provide 98-116% of the daily value (DV) for vitamin B12. In addition, you can meet your daily vitamin B6 needs by consuming two servings of tuna, which provides 100% of the DV for this nutrient.
Vitamin Comparison
Minerals
Tuna is the winner in the category of minerals, containing higher levels of magnesium, phosphorus, iron, potassium, selenium, and zinc. Tuna is also a little lower in sodium.
However, salmon is richer in calcium, copper, and manganese.
Notably, 50g of tuna can provide about 98% of the DV for selenium.
Mineral Comparison
Glycemic Index
As salmon and tuna contain no carbohydrates, the glycemic index is considered to be 0. You can find more information about the glycemic index of foods containing no carbohydrates on our website.
Insulin Index
The insulin index of foods demonstrates how much the given food raises blood insulin levels after intake.
While there has not yet been research regarding the insulin index of salmon, this index has been measured to be 22 for tuna. This is considered a low insulin index.
Acidity
Fresh tuna is a little more acidic when compared to fresh salmon. The pH value of fresh tuna falls in the range of 5.2 to 6.1, while the pH of fresh salmon falls between 6.1 to 6.3 (1, 4). Both fresh tuna and fresh salmon are slightly acidic. The pH of the fish increases, becoming more alkaline as it starts to spoil.
We can also measure acidity by looking at the potential renal acid load or the food's PRAL value. This value demonstrates how much acid or base the food produces inside the organism.
The PRAL values for tuna and salmon are 14.1 and 5.9, respectively. This shows that tuna is significantly more acid-producing than salmon.
Weight Loss & Diets
Salmon and tuna contain a similar amount of calories. One serving of salmon or tuna, while providing a moderate amount of calories, also supplies numerous healthy nutrients.
Salmon containing slightly fewer calories per serving might be the better choice for a low-calorie diet. Tuna, on the other hand, is the preferred option for a low-fat diet. Tuna and salmon both fit well into low-carb and low-glycemic-index diets.
Studies have shown that incorporating lean or fatty fish into restricted-energy diets results in greater weight loss than the same restricted-energy diet without seafood (5).
The supplementation of protein found in salmon, hydrolysate, has been demonstrated to positively affect body mass index in overweight people (6).
Consumption of boiled tuna has also been shown to have potential anti-obesity effects in obese mice (7).
Health Benefits
Now that we know what nutritional components these fish contain, we will examine how they affect our health.
Cardiovascular Health
One study concluded that consuming tuna and other broiled or baked fish, but not fried fish or fish sandwiches, was associated with a lower risk of ischemic heart disease, especially decreasing the risk of death from arrhythmic ischemic heart disease (8).
Supplementation of fish products rich in omega-3 fatty acids, such as salmon or tuna, and a weight loss diet can substantially reduce the risk of heart disease in overweight patients with high blood pressure (9).
Omega-3 fatty acids have also been found to possess anti-triglyceridemic, hemostatic, antiarrhythmic, anti-atherogenic, and antithrombotic qualities, improving the heart’s structure and function (10).
Overall, consuming both tuna and salmon is associated with better heart health.
The American Heart Association recommends the consumption of fatty fish twice a week (11).
According to research, combining statins (such as Atorvastatin, Rosuvastatin, etc.) with omega-3 fats is an effective and well-tolerated treatment for dyslipidemia. This combination may also benefit patients with a recent myocardial infarction.
Diabetes
Tuna and salmon, containing no carbohydrates, cause little to no effect on blood glucose levels after consumption.
Daily consumption of one serving of lean, but not fatty, fish has been studied to have beneficial effects on type 2 diabetes (12). As salmon and tuna are fatty fish, most studies show their consumption does not significantly affect the development of diabetes (13).
Nervous System
Chronic psychological or physiological stress can cause neuroinflammation, which is linked to the development of depression. Omega-3 PUFAs and their derivatives have been shown to reduce neuroinflammation and improve brain health. Low omega-3 PUFA levels, particularly EPA, have been linked to negative mood, poor cognitive performance, sleep disturbance, aggression, and impulsive conduct. Products high in omega-3 PUFAs may help with these symptoms (14).
Immune Function
Salmon is richer in vitamins D and E, essential to maintaining a healthy antioxidative state and immune system (15)(16).
Cancer
Limited evidence suggests that fish consumption can decrease the risk of colorectal and liver cancers (17).
Fish high in omega-3 fatty acids may also improve prostate cancer survival rates (18).
Downsides and Risks
Diabetes
A potential correlation has been discovered between an increased risk of diabetes and the consumption of farmed salmon, as it may contain persistent organic pollutants that cause insulin resistance and obesity in laboratory mice (19). Wild salmon does not pose similar risks.
Cancer
While baked fish might positively affect health, a high intake of grilled or broiled and charbroiled or barbecued fish may increase the risk of stomach cancer (20).
Mercury Poisoning
Mercury is a toxic metal found in our environment due to pollution. Consequently, when fish consume mercury, they can be a source of mercury poisoning for humans. Wild fish contain higher mercury content than farmed fish.
One study has found wild bluefin tuna contains higher mercury levels than Atlantic and chinook salmon (21).
Most commercial seafood has been studied to contain less than the maximum residue limit of mercury (22) and to be a good source of omega-3 fatty acids (23). However, pregnant women are still advised to stay away from fish high in mercury, as high levels of this toxin are hazardous for developing brains (24).
Classification
The term salmon includes multiple species of fish that belong to the Salmonidae family. Other types of fish in this family include trout and whitefish.
Salmon is classified as part of the oily fish species; therefore, they are high in omega-3 fatty acids and fat-soluble vitamins.
Tuna, also known as tunny, is part of the Thunnini tribe of the Scombridae family. Tuna shares this family with mackerels and kingfishes.
Overall, fish is classified as white meat.
Appearance
Raw tuna tends to be darker in color when compared to raw salmon due to the higher level of myoglobin and iron. Raw salmon has a light red or orange hue.
Salmon and tuna, when cooked, lose color, becoming different shades of light pink or white.
Raw meat often has visible wavy white lines called marbling. These are lines of intramuscular fat. Salmon is often richer in fat, having more marbling. Farm-raised salmon tend to be similar to tuna in lack of marbling.
Taste and Use
Tuna and salmon are not too dissimilar in taste. Salmon is often described as having a more robust flavor than tuna. The taste of these fish mostly depends on how they’re cooked.
Depending on availability, salmon and tuna can be used fresh or canned. Fresh fish is often served raw, smoked, or cooked.
Salmon and tuna are frequently used in sushi.
What’s Healthier, Tuna or Salmon?
Well, it depends on so many variables. They are both healthy fish that you should consume. However, if you're pregnant, you should not consume tuna and raw fish.
Tuna is a better option if you’re going for a low-calorie and high-protein diet.
They are both healthy. Depending on the situation, one can prove to be a better and healthier option than the other.
Salmon is a fattier fish that is more flavorful than tuna, which is leaner and contains less fats and more proteins.
Varieties
The six major species included in the term salmon are the Atlantic, King (Chinook), Sockeye (Red), Coho (Silver), Pink (Humpback), and Chum (Dog, Silverbrite). These species can differ in their nutritional values. The king salmon, being the largest one, contains the most fat. Chum, on the other hand, has the lowest percentage of fat. All of these species are similarly rich in protein.
Fifteen species comprise the tuna tribe, of which the four most commonly consumed types are the Atlantic bluefin, the albacore or longfin, the skipjack, and the yellowfin or Ahi. Canned tuna is often of the albacore variety, while bluefin is used fresh.
Tuna and salmon can also be wild-caught or farm-raised. While farm-raised fish can contain antibiotics, wild-caught fish are at a higher risk of contamination with toxins such as mercury and dioxin-like compounds.
Sources
- https://www.researchgate.net/publication/7514503
- https://fdc.nal.usda.gov/fdc-app.html#/food-details/173706/nutrients
- https://fdc.nal.usda.gov/fdc-app.html#/food-details/175167/nutrients
- https://www.researchgate.net/publication/343396902
- https://www.nature.com/articles/0803643
- https://www.researchgate.net/publication/297727596
- https://pubmed.ncbi.nlm.nih.gov/27498820/
- https://www.ahajournals.org/doi/full/10.1161/01.CIR.0000055315.79177.16
- https://academic.oup.com/ajcn/article/70/5/817/4729086
- https://www.ncbi.nlm.nih.gov/pmc/articles/PMC3712371/
- https://www.heart.org/en/healthy-living/healthy-eating/eat-smart/fats/fish-and-omega-3-fatty-acids
- https://www.sciencedirect.com/science/article/abs/pii/S0002914905021880
- https://journals.plos.org/plosone/article?id=10.1371/journal.pone.0089845
- https://www.ncbi.nlm.nih.gov/pmc/articles/PMC2768220/
- https://pubmed.ncbi.nlm.nih.gov/28722941/
- https://pubmed.ncbi.nlm.nih.gov/32491669/
- https://www.frontiersin.org/articles/10.3389/fpsyt.2022.933704/full#B79
- https://www.wcrf.org/dietandcancer/exposures/meat-fish-dairy
- https://www.ncbi.nlm.nih.gov/pmc/articles/PMC2843087/
- https://journals.plos.org/plosone/article?id=10.1371/journal.pone.0025170
- https://www.ncbi.nlm.nih.gov/pmc/articles/PMC3556626/
- https://www.ncbi.nlm.nih.gov/pmc/articles/PMC5985176/
- https://www.researchgate.net/publication/5640885
- Make smart seafood choices to minimize mercury intake

Infographic
Comparison summary table
|
|
||
| Lower in Sodium |
|
||
| Lower in Cholesterol |
|
||
| Lower in Saturated Fat |
|
||
| Lower in price |
|
||
| Rich in vitamins |
|
||
| Lower in Sugar | Equal | ||
| Lower in Glycemic Index | Equal | ||
| Rich in minerals | Equal | ||
All nutrients comparison - raw data values
| Nutrient | |
|
Opinion |
| Protein | 22.1g | 29.15g |
|
| Fats | 12.35g | 0.59g |
|
| Calories | 206kcal | 130kcal |
|
| Calcium | 15mg | 4mg |
|
| Iron | 0.34mg | 0.92mg |
|
| Magnesium | 30mg | 42mg |
|
| Phosphorus | 252mg | 333mg |
|
| Potassium | 384mg | 527mg |
|
| Sodium | 61mg | 54mg |
|
| Zinc | 0.43mg | 0.45mg |
|
| Copper | 0.049mg | 0.043mg |
|
| Manganese | 0.016mg | 0.013mg |
|
| Selenium | 41.4µg | 108.2µg |
|
| Vitamin A | 230IU | 65IU |
|
| Vitamin A RAE | 69µg | 22µg |
|
| Vitamin E | 1.14mg | 0.29mg |
|
| Vitamin D | 526IU | 82IU |
|
| Vitamin D | 13.1µg | 2µg |
|
| Vitamin C | 3.7mg | 0mg |
|
| Vitamin B1 | 0.34mg | 0.134mg |
|
| Vitamin B2 | 0.135mg | 0.137mg |
|
| Vitamin B3 | 8.045mg | 22.07mg |
|
| Vitamin B5 | 1.475mg | 0.334mg |
|
| Vitamin B6 | 0.647mg | 1.038mg |
|
| Folate | 34µg | 2µg |
|
| Vitamin B12 | 2.8µg | 2.35µg |
|
| Vitamin K | 0.1µg | 0.1µg | |
| Tryptophan | 0.248mg | 0.313mg |
|
| Threonine | 0.969mg | 1.224mg |
|
| Isoleucine | 1.018mg | 1.287mg |
|
| Leucine | 1.796mg | 2.27mg |
|
| Lysine | 2.03mg | 2.565mg |
|
| Methionine | 0.654mg | 0.827mg |
|
| Phenylalanine | 0.863mg | 1.091mg |
|
| Valine | 1.139mg | 1.438mg |
|
| Histidine | 0.651mg | 0.822mg |
|
| Cholesterol | 63mg | 47mg |
|
| Trans Fat | 0.02g |
|
|
| Saturated Fat | 2.397g | 0.205g |
|
| Omega-3 - DHA | 1.457g | 0.105g |
|
| Omega-3 - EPA | 0.69g | 0.015g |
|
| Omega-3 - DPA | 0.17g | 0.005g |
|
| Monounsaturated Fat | 4.181g | 0.138g |
|
| Polyunsaturated fat | 4.553g | 0.175g |
|
| Omega-6 - Eicosadienoic acid | 0.002g |
|
Which food is preferable for your diet?
|
|
|
| Low Fats diet |
|
|
| Low Carbs diet | Equal | |
| Low Calories diet |
|
|
| Low Glycemic Index diet | Equal | |


