Gouda Cheese vs. Monterey Jack — What's The Difference?


Summary
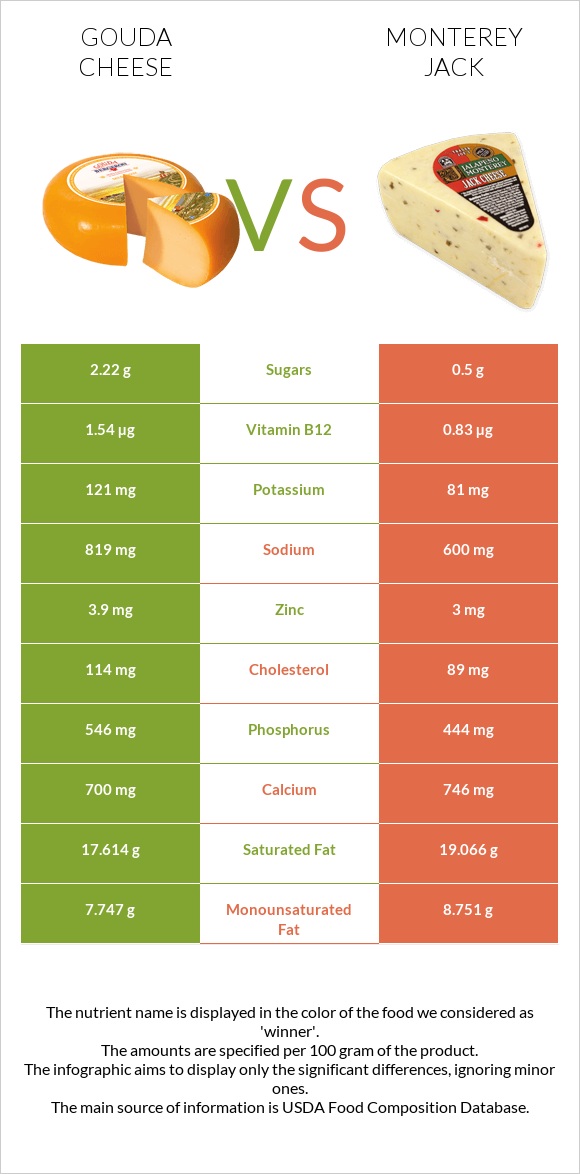
Monterey Jack is a white semi-soft cheese with higher calories and total fats. It is richer in iron, calcium, vitamins D, A, and B2. In comparison, gouda cheese is a yellow semi-hard cheese that is higher in sodium and richer in zinc, phosphorus, vitamin B12, B5, and folate.
Table of contents
Introduction
Your next cheese selection can be either one of two options: Gouda cheese or Monterey Jack. Both of them are widely consumed cheeses, but gouda is consumed more.
This article will compare them according to their nutritional content, some health impacts, and general differences.
It is important to explore the differences between Gouda and Monterey Jack since they are two of the favorite cheeses widely included in many cuisines.
One of the main differences between Gouda and Monterey Jack is the color. Gouda is mostly a yellow to orange cheese, depending on the amount of annatto used and if it’s aged or not. In comparison, Monterey Jack is a white cheese that sometimes can have a yellowish tint in cases of annatto used.
Annatto is a natural food colorant that gives cheese yellow to orange tints.
Nutrition
This section will consider 100g of gouda cheese and Monterey Jack cheese.
Calories
Monterey Jack has slightly higher calories than gouda, but the difference is minimal.
Carbs
Their carb content is negligible, although gouda has 2.2g per 100g.
Protein
They have similar amounts of protein. Noting that their protein content is high.
Fats
Monterey Jack is higher in total fats compared to Gouda. They are both high in their fat content.
The ratio between saturated and unsaturated fats is similar regarding their fatty acid profile. Overall, Monterey Jack has a higher amount of each.
Gouda and Monterey Jack are mainly composed of saturated fats.
Minerals
Gouda is richer in zinc and phosphorous. However, gouda is also much higher in sodium.
In comparison, Monterey Jack is richer in iron and calcium.
Both are equally rich in selenium and magnesium.
The amount of sodium is high in both gouda and Monterey Jack. Monterey Jack has less sodium. Yet it is important to consider this amount in both.
Mineral Comparison
Vitamins
Gouda cheese is richer in vitamins B5, B12, and folate. Monterey Jack is richer in vitamins D, A, and B2.
Vitamin Comparison
You can read about feta vs. cheddar cheese in this article.
Health Impacts
When it comes to their health impacts, they share some common grounds. However, some differences do exist.
Cheese consumption is inversely associated with all-cause mortality. However, these are in moderate amounts.
Cardiovascular Health
According to this study, Gouda cheese contains peptides that may help reduce arterial blood pressure by inhibiting angiotensin-converting enzyme (ACE). It is unclear if Monterey Jack has the same effect (1.2).
It is important to note that gouda cheese contains a higher amount of sodium than Monterey Jack cheese. Consuming high amounts of sodium can have negative effects on the cardiovascular system by increasing the risk of hypertension. Patients with hypertension who consume high-sodium foods may experience uncontrolled blood pressure, which can lead to a higher risk of complications and mortality rates due to cardiovascular diseases (3).
In addition, both have high amounts of saturated fats, so when not consumed in moderation, they tend to increase the risks of high LDL cholesterol and cardiovascular problems (4).
Digestive Health
Some individuals who have IBS and track their food often have flare-ups of IBS when it comes to yellow and orange cheeses, including gouda. An annatto added to these cheeses can act as an IBS trigger. More research is needed regarding this topic since this is just the tip of the iceberg (5)(6)(7).
General Differences
The main difference between these cheeses is that one is yellow to orange, and the other is white.
Taste and Texture
When it comes to taste and texture, they also have some differences.
Gouda is a semi-hard texture cheese made from cow milk from the Netherlands. Gouda has a creamy, nutty flavor and smooth texture. Depending on the amount of aging, it can have different textures and tastes. As it ages, it becomes more intense in flavor and crumbly in texture.
Monterey Jack is a semi-soft cheese made from cow milk from the US. It has a mild flavor and a smooth and creamy texture. It is a versatile cheese often used in quesadillas and grilled cheese sandwiches.
References
- https://pubmed.ncbi.nlm.nih.gov/33799462/
- https://pubmed.ncbi.nlm.nih.gov/10908049/
- https://pubmed.ncbi.nlm.nih.gov/35246796/
- https://pubmed.ncbi.nlm.nih.gov/30084105/
- https://www.ncbi.nlm.nih.gov/pmc/articles/PMC10376437/
- https://journals.lww.com/jcge/fulltext/2009/11000/annatto_and_ibs.27.aspx
- https://journals.lww.com/jcge/fulltext/2009/11000/annatto,_diet,_and_the_irritable_bowel_syndrome.3.aspx

Infographic
Macronutrient Comparison
Fat Type Comparison
Comparison summary table
|
|
||
| Lower in Sugar |
|
||
| Lower in Sodium |
|
||
| Lower in Cholesterol |
|
||
| Lower in Saturated Fat |
|
||
| Lower in Glycemic Index |
|
||
| Lower in price |
|
||
| Rich in minerals |
|
||
| Rich in vitamins | Equal | ||
All nutrients comparison - raw data values
| Nutrient | |
|
Opinion |
| Net carbs | 2.22g | 0.68g |
|
| Protein | 24.94g | 24.48g |
|
| Fats | 27.44g | 30.28g |
|
| Carbs | 2.22g | 0.68g |
|
| Calories | 356kcal | 373kcal |
|
| Sugar | 2.22g | 0.5g |
|
| Calcium | 700mg | 746mg |
|
| Iron | 0.24mg | 0.72mg |
|
| Magnesium | 29mg | 27mg |
|
| Phosphorus | 546mg | 444mg |
|
| Potassium | 121mg | 81mg |
|
| Sodium | 819mg | 600mg |
|
| Zinc | 3.9mg | 3mg |
|
| Copper | 0.036mg | 0.032mg |
|
| Manganese | 0.011mg | 0.011mg | |
| Selenium | 14.5µg | 14.5µg | |
| Vitamin A | 563IU | 769IU |
|
| Vitamin A RAE | 165µg | 198µg |
|
| Vitamin E | 0.24mg | 0.26mg |
|
| Vitamin D | 20IU | 22IU |
|
| Vitamin D | 0.5µg | 0.6µg |
|
| Vitamin B1 | 0.03mg | 0.015mg |
|
| Vitamin B2 | 0.334mg | 0.39mg |
|
| Vitamin B3 | 0.063mg | 0.093mg |
|
| Vitamin B5 | 0.34mg | 0.21mg |
|
| Vitamin B6 | 0.08mg | 0.079mg |
|
| Folate | 21µg | 18µg |
|
| Vitamin B12 | 1.54µg | 0.83µg |
|
| Vitamin K | 2.3µg | 2.5µg |
|
| Tryptophan | 0.352mg | 0.315mg |
|
| Threonine | 0.93mg | 0.871mg |
|
| Isoleucine | 1.306mg | 1.519mg |
|
| Leucine | 2.564mg | 2.344mg |
|
| Lysine | 2.654mg | 2.037mg |
|
| Methionine | 0.719mg | 0.641mg |
|
| Phenylalanine | 1.431mg | 1.289mg |
|
| Valine | 1.806mg | 1.635mg |
|
| Histidine | 1.032mg | 0.859mg |
|
| Cholesterol | 114mg | 89mg |
|
| Saturated Fat | 17.614g | 19.066g |
|
| Monounsaturated Fat | 7.747g | 8.751g |
|
| Polyunsaturated fat | 0.657g | 0.899g |
|
Which food is preferable for your diet?
|
|
|
| Low Fats diet |
|
|
| Low Carbs diet |
|
|
| Low Calories diet |
|
|
| Low Glycemic Index diet |
|
People also compare


Vitamins & Minerals Daily Need Coverage Score
Comparison summary
References
All the values for which the sources are not specified explicitly are taken from FDA’s Food Central. The exact link to the food presented on this page can be found below.
- Gouda cheese - https://fdc.nal.usda.gov/fdc-app.html#/food-details/171241/nutrients
- Monterey Jack - https://fdc.nal.usda.gov/fdc-app.html#/food-details/170844/nutrients
All the Daily Values are presented for males aged 31-50, for 2000-calorie diets.