Nutmeg vs. Cinnamon — Health Impact and Nutrition Comparison


Summary
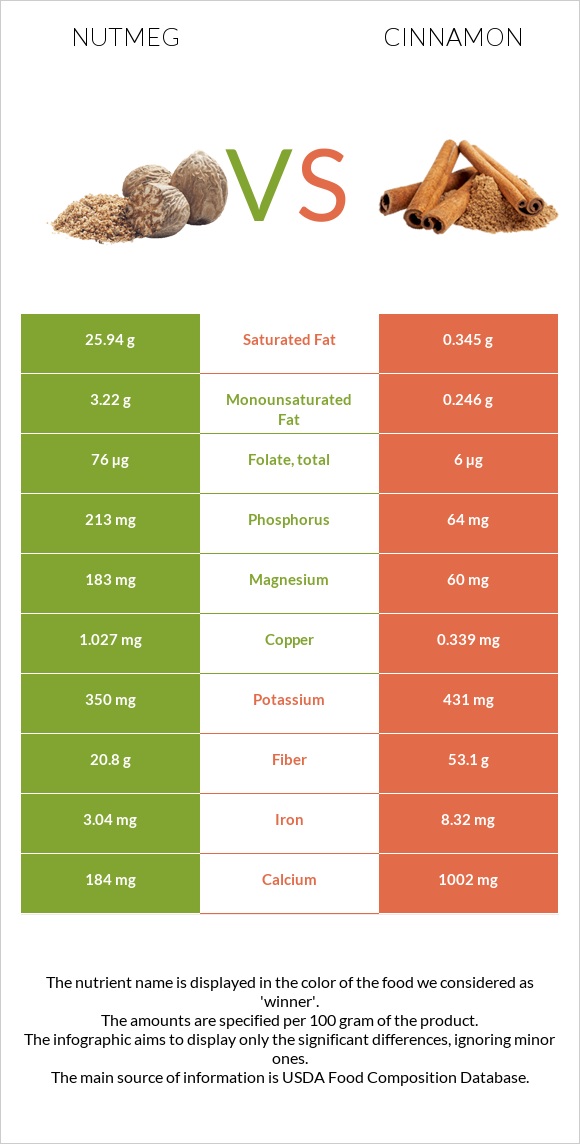
Nutmeg is richer in vitamin B1, magnesium, zinc, and phosphorus. Cinnamon is higher in vitamin A, calcium, and potassium. Cinnamon provides three times more vitamin C than Nutmeg. Cinnamon is lower in all types of fats.
Table of contents
Introduction
In this article, we will compare Nutmeg (1) and Cinnamon (2), focusing on their nutritional content and health impact.
Actual differences
Cinnamon is the bark of a cinnamon tree from Sri Lanka, while Nutmeg is the fruit of Indonesian Myristica fragrans. Nutmeg has a subtle, pungent, and slightly spicy aroma. Cinnamon has a sweet, a bit spicy, and warm flavor. Nutmeg is commonly used in savory dishes, while cinnamon is usually in sweet dishes; in Middle Eastern cuisine, it is also used in savory dishes.
Nutritional content comparison
Since we use nutmeg and cinnamon as spices, most macronutrients and calories are not of big impact.
Calories
Nutmeg is high in calories, while Cinnamon is a medium-calorie food.
It is important to note that we do not consume nutmeg and cinnamon in high amounts, so they will not have an impact on our daily calorie intake.
Nutmeg is almost two times higher in calories than Cinnamon.
Nutmeg provides 525 calories per 100g, and Cinnamon contains 247 calories per the same amount.
Minerals
Nutmeg is higher in magnesium, phosphorus, zinc, and copper. Nutmeg contains three times more magnesium than Cinnamon. Cinnamon is higher in calcium, iron, and potassium.
You can check the mineral comparison chart below.
Mineral Comparison
Vitamins
Although Nutmeg and Cinnamon are packed with vitamins, Cinnamon is relatively richer in vitamins. Cinnamon is richer in vitamins A, C, E, and K. It is approximately three times higher in vitamin A than Nutmeg.
Nutmeg is higher in vitamins B1, B2, and folate.
Vitamin Comparison
Fats
Nutmeg is higher in fats than Cinnamon. It contains 36.3g of fats per 100g, while the same serving of Cinnamon provides 1.2g. However, no one eats 100g of nutmeg.
Cinnamon is significantly lower in saturated fats. Nutmeg is also higher in mono/polyunsaturated fats.
Carbs
Cinnamon contains more carbs than Nutmeg. It has 80.6g of carbs per 100g, while Nutmeg has only 49.3g per 100g.
Fiber
Both Nutmeg and cinnamon are rich in fiber. However, Cinnamon is 32.3g higher in fiber than Nutmeg. Cinnamon is especially richer in insoluble fiber.
Health impact
Cardiovascular health
Cinnamon and Nutmeg are involved in reducing the risk of heart disease.
Cinnamon reduces the levels of bad or LDL cholesterol (3). It also can be involved in regulating blood pressure (4).
An animal study shows that Nutmeg reduces heart disease risk factors, such as triacylglycerides and cholesterol (5). However, more research is needed to confirm these statements.
Anti-inflammatory effects
Inflammation is linked to several health conditions, such as diabetes, heart disease, and arthritis (6).
Cinnamon reduces inflammation by containing cinnamaldehyde (7).
Nutmeg contains anti-inflammatory chemicals called monoterpenes (8). However, more studies are needed to confirm the anti-inflammatory effects of Nutmeg in humans.
Blood sugar control
A study shows that high-dose nutmeg extract can reduce blood sugar levels and promote pancreatic function (9).
Cinnamon is famous for its anti-diabetic properties. It slows the digestion of carbohydrates in the intestine by inhibiting the enzymes responsible for that function (10) (11). Cinnamon contains a chemical called hydroxychalcone, which mimics insulin in our organism (11) (12). Cinnamon is linked with higher insulin sensitivity (13).
References
- https://fdc.nal.usda.gov/fdc-app.html#/food-details/171326/nutrients
- https://fdc.nal.usda.gov/fdc-app.html#/food-details/171320/nutrients
- https://pubmed.ncbi.nlm.nih.gov/14633804/
- https://www.ncbi.nlm.nih.gov/pmc/articles/PMC4003790/
- https://www.ncbi.nlm.nih.gov/pmc/articles/PMC4502738/
- https://www.ncbi.nlm.nih.gov/books/NBK493173/
- https://pubmed.ncbi.nlm.nih.gov/25629927/
- https://www.ncbi.nlm.nih.gov/pmc/articles/PMC5222521/
- https://pubmed.ncbi.nlm.nih.gov/31063201/
- https://pubmed.ncbi.nlm.nih.gov/21711570/
- https://pubmed.ncbi.nlm.nih.gov/21538147/
- https://pubmed.ncbi.nlm.nih.gov/9762007/
- https://www.ncbi.nlm.nih.gov/pmc/articles/PMC2901047/

Infographic
Macronutrient Comparison
Fat Type Comparison
Comparison summary table
|
|
||
| Lower in Glycemic Index |
|
||
| Lower in Sugar |
|
||
| Lower in Sodium |
|
||
| Lower in Saturated Fat |
|
||
| Lower in price |
|
||
| Lower in Cholesterol | Equal | ||
| Rich in minerals | Equal | ||
| Rich in vitamins | Equal | ||
All nutrients comparison - raw data values
| Nutrient | |
|
Opinion |
| Net carbs | 28.49g | 27.49g |
|
| Protein | 5.84g | 3.99g |
|
| Fats | 36.31g | 1.24g |
|
| Carbs | 49.29g | 80.59g |
|
| Calories | 525kcal | 247kcal |
|
| Fructose | 1.11g |
|
|
| Sugar | 2.99g | 2.17g |
|
| Fiber | 20.8g | 53.1g |
|
| Calcium | 184mg | 1002mg |
|
| Iron | 3.04mg | 8.32mg |
|
| Magnesium | 183mg | 60mg |
|
| Phosphorus | 213mg | 64mg |
|
| Potassium | 350mg | 431mg |
|
| Sodium | 16mg | 10mg |
|
| Zinc | 2.15mg | 1.83mg |
|
| Copper | 1.027mg | 0.339mg |
|
| Manganese | 2.9mg | 17.466mg |
|
| Selenium | 1.6µg | 3.1µg |
|
| Vitamin A | 102IU | 295IU |
|
| Vitamin A RAE | 5µg | 15µg |
|
| Vitamin E | 0mg | 2.32mg |
|
| Vitamin C | 3mg | 3.8mg |
|
| Vitamin B1 | 0.346mg | 0.022mg |
|
| Vitamin B2 | 0.057mg | 0.041mg |
|
| Vitamin B3 | 1.299mg | 1.332mg |
|
| Vitamin B5 | 0.358mg |
|
|
| Vitamin B6 | 0.16mg | 0.158mg |
|
| Folate | 76µg | 6µg |
|
| Vitamin K | 0µg | 31.2µg |
|
| Tryptophan | 0.049mg |
|
|
| Threonine | 0.136mg |
|
|
| Isoleucine | 0.146mg |
|
|
| Leucine | 0.253mg |
|
|
| Lysine | 0.243mg |
|
|
| Methionine | 0.078mg |
|
|
| Phenylalanine | 0.146mg |
|
|
| Valine | 0.224mg |
|
|
| Histidine | 0.117mg |
|
|
| Saturated Fat | 25.94g | 0.345g |
|
| Monounsaturated Fat | 3.22g | 0.246g |
|
| Polyunsaturated fat | 0.35g | 0.068g |
|
| Omega-3 - ALA | 0.011g |
|
Which food is preferable for your diet?
|
|
|
| Low Fats diet |
|
|
| Low Carbs diet |
|
|
| Low Calories diet |
|
|
| Low Glycemic Index diet |
|
People also compare


Vitamins & Minerals Daily Need Coverage Score
Comparison summary
References
All the values for which the sources are not specified explicitly are taken from FDA’s Food Central. The exact link to the food presented on this page can be found below.
- Nutmeg - https://fdc.nal.usda.gov/fdc-app.html#/food-details/171326/nutrients
- Cinnamon - https://fdc.nal.usda.gov/fdc-app.html#/food-details/171320/nutrients
All the Daily Values are presented for males aged 31-50, for 2000-calorie diets.