Mineral coverage chart - definition and explanation
Minerals are inorganic molecules which means they exist in the nature. Minerals are micronutrients, that is our organism needs minerals in small quantities. But it does not mean that the role minerals play in the organism’s well functioning and health is minor. Some nutrients are truly essential for us. Those include Potassium (4700 mg), Choline (2300mg), Sodium (1500mg), Calcium(1000mg), Phosphorus(700mg), Magnesium(420mg), Zinc(11mg), Iron(18mg), Manganese (2.3mg), Cooper( 0.9mg), Iodine (0.15mg), Selenium (0.055mg), Molybdenum (0.045mg). The numbers in brackets represent the Recommended Dietary Allowance which is the amount that is considered sufficient for the daily intake. Some nutrients such as Potassium and Sodium are required in much bigger quantities.
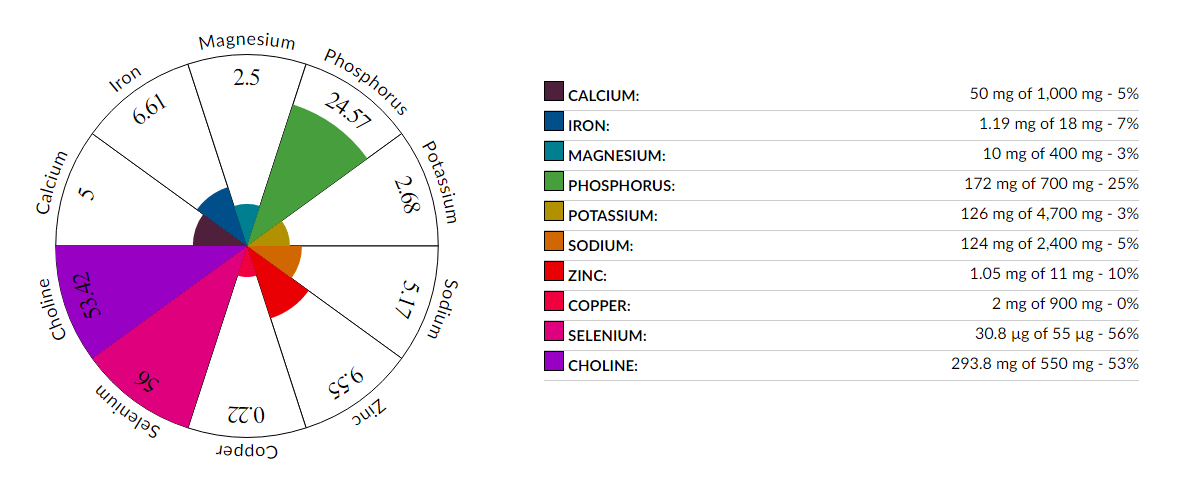
Example: Mineral coverage chart for EGG
Data provided by FoodStruct.com should be considered and used as information only. Please consult your physician before beginning any diet.