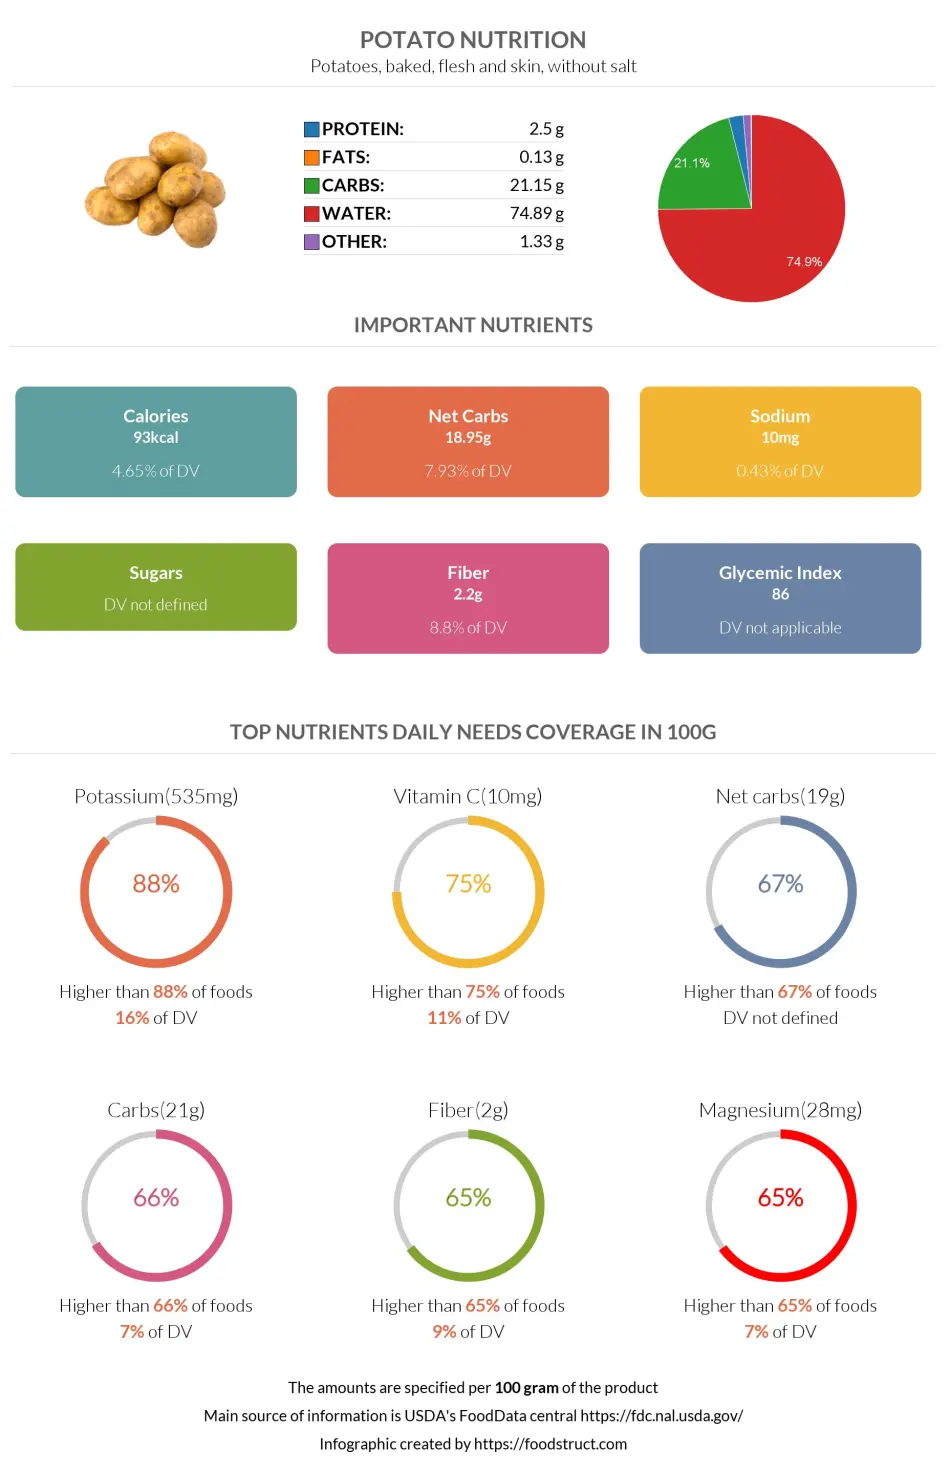
Potato nutrition: calories, carbs, GI, protein, fiber, fats
Potatoes, baked, flesh and skin, without salt
*all the values are displayed for the amount of 100 grams
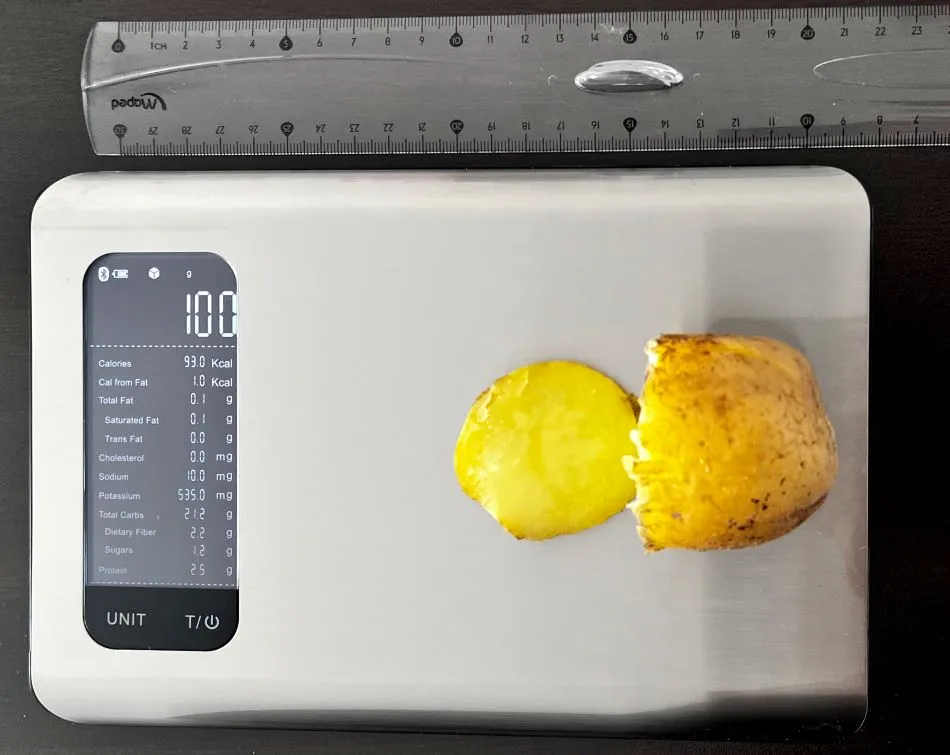
What Do 93 Calories or 100 Grams of Potato Look Like?
The picture below shows what 100 grams of potato looks like to help you visualize its weight and calories. As you can see, about half of a middle-sized cooked potato makes up 100 grams or 93 calories, meaning one whole potato is about 200 grams or 186 calories.
Important nutritional characteristics for Potato
|
Glycemic index ⓘ
Source:
The GI of purple potatoes is 77, red poatoes have a GI of 78, yellow and white potatoes have higher GIs, 81 and 93 respectively. https://www.researchgate.net/publication/260430587
Check out our Glycemic index chart page for the full list.
|
86 (high) |
| Glycemic load | 24 (high) |
| Insulin index ⓘ II for boiled Russet potatoes https://academic.oup.com/ajcn/article/66/5/1264/4655967 | 121 |
| Calories ⓘ Calories per 100-gram serving | 93 |
| Net Carbs ⓘ Net Carbs = Total Carbohydrates – Fiber – Sugar Alcohols | 18.95 grams |
| Serving Size ⓘ Serving sizes are taken from FDA's Reference Amounts Customarily Consumed (RACCs) | 1 NLEA serving (148 grams) |
| Acidity (Based on PRAL) ⓘ PRAL (Potential renal acid load) is calculated using a formula. On the PRAL scale the higher the positive value, the more is the acidifying effect on the body. The lower the negative value, the higher the alkalinity of the food. 0 is neutral. | -8.3 (alkaline) |
| Oxalates ⓘ https://www.researchgate.net/publication/280642641 | 27mg |
Potassium ⓘHigher in Potassium content than 88% of foods
Vitamin C ⓘHigher in Vitamin C content than 75% of foods
Net carbs ⓘHigher in Net carbs content than 67% of foods
Carbs ⓘHigher in Carbs content than 66% of foods
Fiber ⓘHigher in Fiber content than 65% of foods
Potato calories (kcal)
| Serving Size | Calories | Weight |
|---|---|---|
| Calories in 100 grams | 93 | |
| Calories in 1 NLEA serving | 138 | 148 g |
| Calories in 1 potato large | 278 | 299 g |
| Calories in 1 potato medium | 161 | 173 g |
| Calories in 1 potato small | 128 | 138 g |
Potato Glycemic index (GI)
Source:
The GI of purple potatoes is 77, red poatoes have a GI of 78, yellow and white potatoes have higher GIs, 81 and 93 respectively. https://www.researchgate.net/publication/260430587
Check out our Glycemic index chart page for the full list.
Potato Glycemic load (GL)
Mineral coverage chart
Calcium:
15 mg of 1,000 mg
2%
Iron:
1.08 mg of 8 mg
14%
Magnesium:
28 mg of 420 mg
7%
Phosphorus:
70 mg of 700 mg
10%
Potassium:
535 mg of 3,400 mg
16%
Sodium:
10 mg of 2,300 mg
0%
Zinc:
0.36 mg of 11 mg
3%
Copper:
0.118 mg of 1 mg
13%
Manganese:
0.219 mg of 2 mg
10%
Selenium:
0.4 µg of 55 µg
1%
Choline:
14.8 mg of 550 mg
3%
Mineral chart - relative view
Potassium
535 mg
TOP 12%
Magnesium
28 mg
TOP 35%
Copper
0.118 mg
TOP 45%
Manganese
0.219 mg
TOP 50%
Iron
1.08 mg
TOP 58%
Calcium
15 mg
TOP 63%
Phosphorus
70 mg
TOP 72%
Zinc
0.36 mg
TOP 77%
Choline
14.8 mg
TOP 80%
Sodium
10 mg
TOP 85%
Selenium
0.4 µg
TOP 91%
Vitamin coverage chart
Vitamin A:
10 IU of 5,000 IU
0%
Vitamin E :
0.04 mg of 15 mg
0%
Vitamin D:
0 µg of 10 µg
0%
Vitamin C:
9.6 mg of 90 mg
11%
Vitamin B1:
0.064 mg of 1 mg
5%
Vitamin B2:
0.048 mg of 1 mg
4%
Vitamin B3:
1.41 mg of 16 mg
9%
Vitamin B5:
0.376 mg of 5 mg
8%
Vitamin B6:
0.311 mg of 1 mg
24%
Folate:
28 µg of 400 µg
7%
Vitamin B12:
0 µg of 2 µg
0%
Vitamin K:
2 µg of 120 µg
2%
Vitamin chart - relative view
Vitamin C
9.6 mg
TOP 25%
Vitamin B6
0.311 mg
TOP 39%
Folate
28 µg
TOP 43%
Vitamin B3
1.41 mg
TOP 64%
Vitamin A
10 IU
TOP 64%
Vitamin B1
0.064 mg
TOP 64%
Vitamin K
2 µg
TOP 65%
Vitamin B5
0.376 mg
TOP 67%
Vitamin B2
0.048 mg
TOP 82%
Vitamin E
0.04 mg
TOP 92%
Vitamin B12
0 µg
TOP 100%
Vitamin D
0 µg
TOP 100%
Macronutrients chart
Protein:
Daily Value: 5%
2.5 g of 50 g
5%
Fats:
Daily Value: 0%
0.13 g of 65 g
0%
Carbs:
Daily Value: 7%
21.15 g of 300 g
7%
Water:
Daily Value: 4%
74.89 g of 2,000 g
4%
Other:
1.33 g
Protein quality breakdown
Tryptophan:
25 mg of 280 mg
9%
Threonine:
81 mg of 1,050 mg
8%
Isoleucine:
80 mg of 1,400 mg
6%
Leucine:
119 mg of 2,730 mg
4%
Lysine:
130 mg of 2,100 mg
6%
Methionine:
38 mg of 1,050 mg
4%
Phenylalanine:
99 mg of 1,750 mg
6%
Valine:
125 mg of 1,820 mg
7%
Histidine:
42 mg of 700 mg
6%
Fat type information
Saturated Fat:
0.034 g
Monounsaturated Fat:
0.003 g
Polyunsaturated fat:
0.057 g
Carbohydrate type breakdown
Starch:
17.27 g
Sucrose:
0.4 g
Glucose:
0.44 g
Fructose:
0.34 g
Lactose:
0 g
Maltose:
0 g
Galactose:
0 g
Fiber content ratio for Potato
Sugar:
1.18 g
Fiber:
2.2 g
Other:
17.77 g
All nutrients for Potato per 100g
| Nutrient | Value | DV% | In TOP % of foods | Comparison |
| Calories | 93kcal | 5% | 75% |
2 times more than Orange
|
| Protein | 2.5g | 6% | 74% |
1.1 times less than Broccoli
|
| Fats | 0.13g | 0% | 91% |
256.2 times less than Cheddar Cheese
|
| Vitamin C | 9.6mg | 11% | 25% |
5.5 times less than Lemon
|
| Net carbs | 18.95g | N/A | 33% |
2.9 times less than Chocolate
|
| Carbs | 21.15g | 7% | 34% |
1.3 times less than Rice
|
| Cholesterol | 0mg | 0% | 100% |
N/A
|
| Vitamin D | 0µg | 0% | 100% |
N/A
|
| Iron | 1.08mg | 14% | 58% |
2.4 times less than Beef broiled
|
| Calcium | 15mg | 2% | 63% |
8.3 times less than Milk
|
| Potassium | 535mg | 16% | 12% |
3.6 times more than Cucumber
|
| Magnesium | 28mg | 7% | 35% |
5 times less than Almond
|
| Sugar | 1.18g | N/A | 65% |
7.6 times less than Coca-Cola
|
| Fiber | 2.2g | 9% | 35% |
1.1 times less than Orange
|
| Copper | 0.12mg | 13% | 45% |
1.2 times less than Shiitake
|
| Zinc | 0.36mg | 3% | 77% |
17.5 times less than Beef broiled
|
| Starch | 17.27g | 7% | 92% |
1.1 times more than Potato
|
| Phosphorus | 70mg | 10% | 72% |
2.6 times less than Chicken meat
|
| Sodium | 10mg | 0% | 85% |
49 times less than White Bread
|
| Vitamin A | 10IU | 0% | 64% |
1670.6 times less than Carrot
|
| Vitamin A RAE | 1µg | 0% | 72% | |
| Vitamin E | 0.04mg | 0% | 92% |
36.5 times less than Kiwifruit
|
| Selenium | 0.4µg | 1% | 91% | |
| Manganese | 0.22mg | 10% | 50% | |
| Vitamin B1 | 0.06mg | 5% | 64% |
4.2 times less than Pea raw
|
| Vitamin B2 | 0.05mg | 4% | 82% |
2.7 times less than Avocado
|
| Vitamin B3 | 1.41mg | 9% | 64% |
6.8 times less than Turkey meat
|
| Vitamin B5 | 0.38mg | 8% | 67% |
3 times less than Sunflower seed
|
| Vitamin B6 | 0.31mg | 24% | 39% |
2.6 times more than Oat
|
| Vitamin B12 | 0µg | 0% | 100% |
N/A
|
| Vitamin K | 2µg | 2% | 65% |
50.8 times less than Broccoli
|
| Folate | 28µg | 7% | 43% |
2.2 times less than Brussels sprout
|
| Trans Fat | 0g | N/A | 100% |
N/A
|
| Saturated Fat | 0.03g | 0% | 88% |
173.4 times less than Beef broiled
|
| Monounsaturated Fat | 0g | N/A | 95% |
3266.3 times less than Avocado
|
| Polyunsaturated fat | 0.06g | N/A | 89% |
827.6 times less than Walnut
|
| Tryptophan | 0.03mg | 0% | 91% |
12.2 times less than Chicken meat
|
| Threonine | 0.08mg | 0% | 91% |
8.9 times less than Beef broiled
|
| Isoleucine | 0.08mg | 0% | 92% |
11.4 times less than Salmon raw
|
| Leucine | 0.12mg | 0% | 92% |
20.4 times less than Tuna Bluefin
|
| Lysine | 0.13mg | 0% | 89% |
3.5 times less than Tofu
|
| Methionine | 0.04mg | 0% | 90% |
2.5 times less than Quinoa
|
| Phenylalanine | 0.1mg | 0% | 91% |
6.7 times less than Egg
|
| Valine | 0.13mg | 0% | 90% |
16.2 times less than Soybean raw
|
| Histidine | 0.04mg | 0% | 92% |
17.8 times less than Turkey meat
|
| Fructose | 0.34g | 0% | 89% |
17.4 times less than Apple
|
| Omega-3 - EPA | 0g | N/A | 100% |
N/A
|
| Omega-3 - DHA | 0g | N/A | 100% |
N/A
|
| Omega-3 - DPA | 0g | N/A | 100% |
N/A
|
Check out similar food or compare with current
NUTRITION FACTS LABEL
Nutrition Facts
___servings per container
Serving Size ______________
Serving Size ______________
Amount Per 100g
Calories 93
% Daily Value*
0%
Total Fat
0g
0%
Saturated Fat 0g
0%
Cholesterol 0mg
0%
Sodium 10mg
7%
Total Carbohydrate
21g
8%
Dietary Fiber
2g
Total Sugars g
Includes ? g Added Sugars
Protein
3g
Vitamin D
0mcg
0%
Calcium
15mg
2%
Iron
1mg
13%
Potassium
535mg
16%
*
The % Daily Value (DV) tells you how much a nutrient in a serving of food contributes to a daily diet. 2,000 calories a day is used for general nutrition advice.
Health checks
Low in Cholesterol
ⓘ
Dietary cholesterol is not associated with an increased risk of coronary heart disease in healthy individuals. However, dietary cholesterol is common in foods that are high in harmful saturated fats.
Source
No Trans Fats
ⓘ
Trans fat consumption increases the risk of cardiovascular disease and mortality by negatively affecting blood lipid levels.
Source
Low in Saturated Fats
ⓘ
Saturated fat intake can raise total cholesterol and LDL (low-density lipoprotein) levels, leading to an increased risk of atherosclerosis. Dietary guidelines recommend limiting saturated fats to under 10% of calories a day.
Source
Low in Sugars
ⓘ
While the consumption of moderate amounts of added sugars is not detrimental to health, an excessive intake can increase the risk of obesity, and therefore, diabetes.
Source
Potato nutrition infographic
Infographic link
References
All the values for which the sources are not specified explicitly are taken from FDA’s Food Central. The exact link to the food presented on this page can be found below.