Butter cookie nutrition: calories, carbs, GI, protein, fiber, fats
Butter Cookie Calories
Calories per 100g
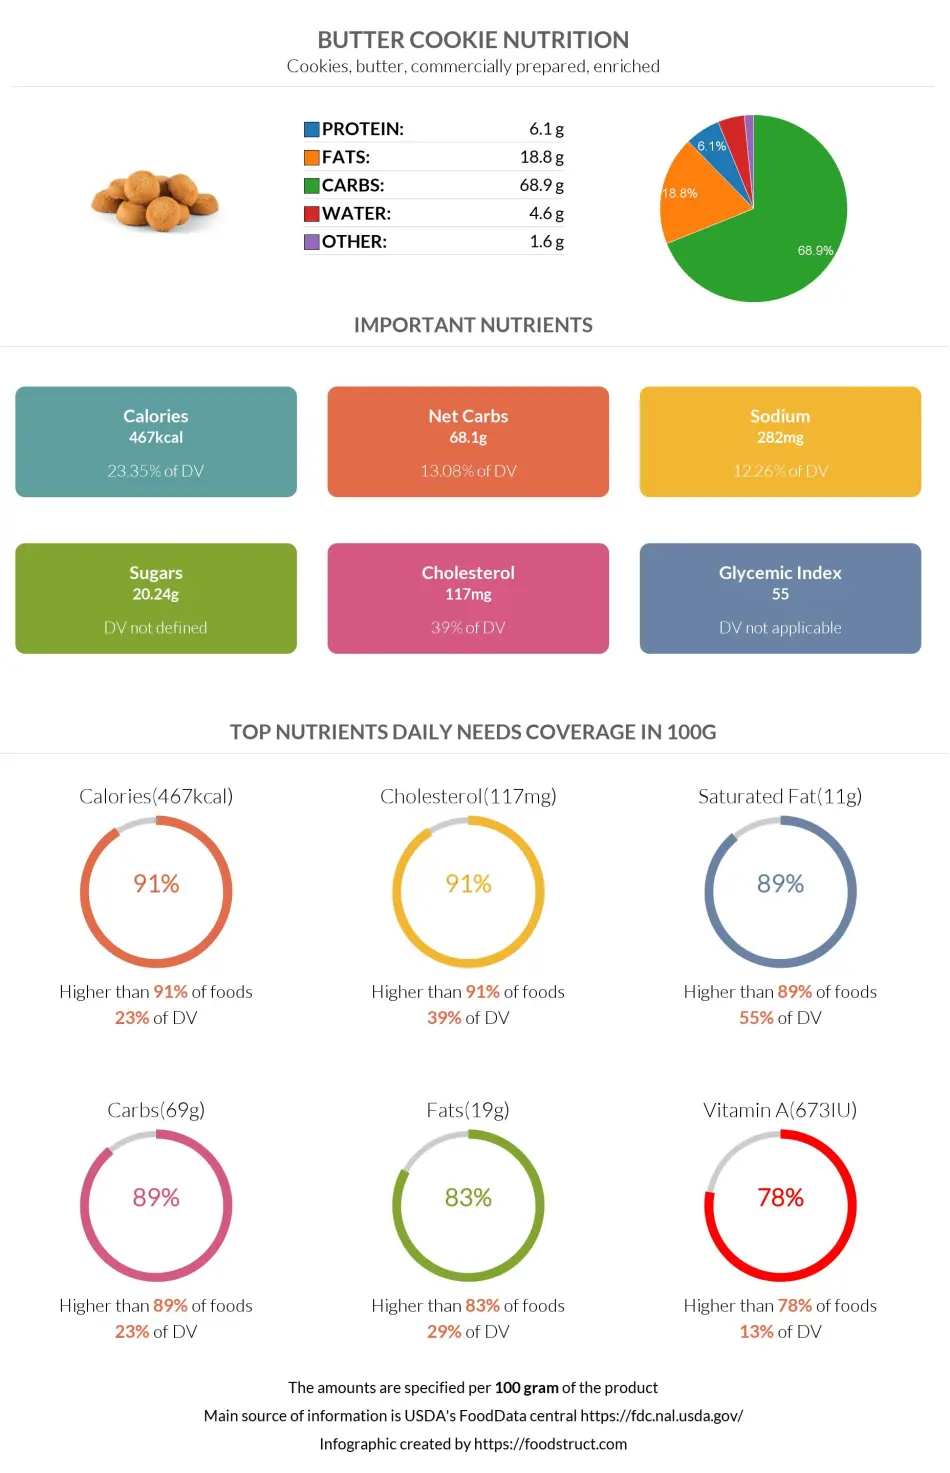
One hundred grams of butter cookie contains 467 calories. The main ingredients that make up the calories are butter and sugar. Butter cookie contains 68.1 g carbs. This makes butter cookies a high-calorie food.
It is a low-volume and high-calorie food.
Macronutrients chart
Calories per serving size
One 100 gram of butter cookie provides 467 calories; however, one cookie (5 grams) usually provides only 23.35 calories accordingly.
Calories per ingredient
In this column, nutritionist sub-recipes are presented for 1 cup:
| Ingredient | Calories |
| flour | 40 |
| butter | 44.8 |
| sugar | 35 |
Comparison
Butter cookies have more calories than fortune cookies and less chocolate chip cookies.
Compared to shortbread, butter cookie contains fewer carbs, so it has fewer calories.
We compared butter cookies to all foods in our database and found it is in the top 9% of foods high in calories. So 91% of foods contain fewer calories than butter cookies.
| Food | Calories per 100 grams |
| Chocolate chip cookie | 488 |
| Butter cookies | 467 |
| Sugar | 387 |
| Fortune cookie | 378 |
| Keebler Oatmeal Cookies | 478 |
Burning estimates
The table below shows the time and type of activity a person should perform to burn 23.35 calories (one butter cookie). Measured by a method called Met or Metabolic Equivalent of a Task [1][2].
| One butter cookie (5 gram) - 70kg person | 100 gram of butter cookie - 100kg person | |
| Walking | 5 min | 19 min |
| Cycling | 2 min | 11 min |
| Running | 2 min | 11 min |
| Aerobics | ~1 min | 8 min |
References

Important nutritional characteristics for Butter cookie
| Glycemic index ⓘ Gi values are taken from various scientific sources. GI values less than 55 are considered as low. Values above 70 are considered as high. | 55 (low) |
| Glycemic load | 2 (low) |
| Calories ⓘ Calories per 100-gram serving | 467 |
| Net Carbs ⓘ Net Carbs = Total Carbohydrates – Fiber – Sugar Alcohols | 68.1 grams |
| Serving Size ⓘ Serving sizes are taken from FDA's Reference Amounts Customarily Consumed (RACCs) | 1 cookie (5 grams) |
| Acidity (Based on PRAL) ⓘ PRAL (Potential renal acid load) is calculated using a formula. On the PRAL scale the higher the positive value, the more is the acidifying effect on the body. The lower the negative value, the higher the alkalinity of the food. 0 is neutral. | 3.7 (acidic) |
Butter cookie calories (kcal)
| Serving Size | Calories | Weight |
|---|---|---|
| Calories in 100 grams | 467 | |
| Calories in 1 oz | 132 | 28.35 g |
| Calories in 1 cookie | 23 | 5 g |
Butter cookie Glycemic index (GI)
Butter cookie Glycemic load (GL)
Mineral coverage chart
Mineral chart - relative view
Vitamin coverage chart
Vitamin chart - relative view
Protein quality breakdown
Fat type information
Fiber content ratio for Butter cookie
All nutrients for Butter cookie per 100g
| Nutrient | Value | DV% | In TOP % of foods | Comparison |
| Calories | 467kcal | 23% | 9% |
9.9 times more than Orange
|
| Protein | 6.1g | 15% | 57% |
2.2 times more than Broccoli
|
| Fats | 18.8g | 29% | 17% |
1.8 times less than Cheddar Cheese
|
| Vitamin C | 0mg | 0% | 100% |
N/A
|
| Net carbs | 68.1g | N/A | 8% |
1.3 times more than Chocolate
|
| Carbs | 68.9g | 23% | 11% |
2.4 times more than Rice
|
| Cholesterol | 117mg | 39% | 9% |
3.2 times less than Egg
|
| Vitamin D | 0.4µg | 4% | 49% |
5.5 times less than Egg
|
| Iron | 2.22mg | 28% | 33% |
1.2 times less than Beef broiled
|
| Calcium | 29mg | 3% | 44% |
4.3 times less than Milk
|
| Potassium | 111mg | 3% | 80% |
1.3 times less than Cucumber
|
| Magnesium | 12mg | 3% | 79% |
11.7 times less than Almond
|
| Sugar | 20.24g | N/A | 33% |
2.3 times more than Coca-Cola
|
| Fiber | 0.8g | 3% | 53% |
3 times less than Orange
|
| Copper | 0.2mg | 22% | 31% |
1.4 times more than Shiitake
|
| Zinc | 0.38mg | 3% | 76% |
16.6 times less than Beef broiled
|
| Phosphorus | 102mg | 15% | 63% |
1.8 times less than Chicken meat
|
| Sodium | 282mg | 12% | 35% |
1.7 times less than White Bread
|
| Vitamin A | 673IU | 13% | 22% |
24.8 times less than Carrot
|
| Vitamin A RAE | 165µg | 18% | 26% | |
| Vitamin E | 0.58mg | 4% | 54% |
2.5 times less than Kiwifruit
|
| Selenium | 8.4µg | 15% | 62% | |
| Manganese | 0.17mg | 7% | 54% | |
| Vitamin B1 | 0.37mg | 31% | 23% |
1.4 times more than Pea raw
|
| Vitamin B2 | 0.34mg | 26% | 22% |
2.6 times more than Avocado
|
| Vitamin B3 | 3.19mg | 20% | 49% |
3 times less than Turkey meat
|
| Vitamin B5 | 0.49mg | 10% | 59% |
2.3 times less than Sunflower seed
|
| Vitamin B6 | 0.04mg | 3% | 85% |
3.3 times less than Oat
|
| Vitamin B12 | 0.36µg | 15% | 53% |
1.9 times less than Pork
|
| Vitamin K | 1.7µg | 1% | 67% |
59.8 times less than Broccoli
|
| Folate | 76µg | 19% | 28% |
1.2 times more than Brussels sprout
|
| Saturated Fat | 11.05g | 55% | 11% |
1.9 times more than Beef broiled
|
| Monounsaturated Fat | 5.52g | N/A | 29% |
1.8 times less than Avocado
|
| Polyunsaturated fat | 0.98g | N/A | 46% |
48 times less than Walnut
|
| Tryptophan | 0.08mg | 0% | 81% |
3.6 times less than Chicken meat
|
| Threonine | 0.22mg | 0% | 82% |
3.3 times less than Beef broiled
|
| Isoleucine | 0.28mg | 0% | 82% |
3.3 times less than Salmon raw
|
| Leucine | 0.47mg | 0% | 82% |
5.2 times less than Tuna Bluefin
|
| Lysine | 0.31mg | 0% | 80% |
1.5 times less than Tofu
|
| Methionine | 0.13mg | 0% | 80% |
1.4 times more than Quinoa
|
| Phenylalanine | 0.3mg | 0% | 82% |
2.2 times less than Egg
|
| Valine | 0.32mg | 0% | 82% |
6.4 times less than Soybean raw
|
| Histidine | 0.14mg | 0% | 83% |
5.5 times less than Turkey meat
|
| Omega-3 - EPA | 0.01g | N/A | 38% |
62.7 times less than Salmon
|
| Omega-3 - DHA | 0.01g | N/A | 41% |
208.6 times less than Salmon
|
| Omega-3 - DPA | 0g | N/A | 100% |
N/A
|
Check out similar food or compare with current
NUTRITION FACTS LABEL
Serving Size ______________
Health checks
Butter cookie nutrition infographic
References
All the values for which the sources are not specified explicitly are taken from FDA’s Food Central. The exact link to the food presented on this page can be found below.