Fish soup nutrition: calories, carbs, GI, protein, fiber, fats
Fish soup calories
Calories per 100g
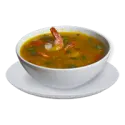
A 100g serving of fish soup has only 16 calories in it. It means that the food is low in calories.
Fish soup covers only 0.8% of the daily calorie requirement. As a result, a cup of it should not suffice for the entire day.
Calories per serving size
Fish soup is usually taken in quantities greater than 100 grams.
A serving size for this type of food is 1 cup (233 grams). A serving of fish soup contains 37.3 calories.
Calories per ingredient
Let us have a look at one of the recipes for fish soup. Its main ingredients are fish (Bluefish), leek, fennel, onion, garlic, white wine, parsley, tarragon, and lemon. Consider that this is a sample recipe, and the preparation methods can vary.
The calorie value of fish soup can change based on the ingredients, their amount, and type. The calories given by each ingredient listed above are mentioned in the table below.
| Ingredient | Size | Calories |
| Ling fish | 500g | 435 |
| Leek | 89g | 54 |
| Fennel | 117g | 36 |
| Onion | 80g | 32 |
| Garlic | 50g | 75 |
| White wine | 500g | 410 |
| Parsley | 20g | 7 |
| Tarragon | 20g | 59 |
| Lemon | 25g | 7 |
| Water | 1000g | 0 |
Comparison
We will compare fish soup's calorie content to that of some other foods. As our dataset indicates, fish soup is higher in calories than 2% of foods.
It is shown in the table below that fish soup provides fewer calories compared to all types of soup. It has almost six times fewer calories than soup beans.
| Food | Calories per 100 grams |
| Broth | 267 |
| Soup beans | 95 |
| Pea soup | 61 |
| Turkey soup | 57 |
| Chicken soup | 36 |
| Fish soup | 16 |
Burning estimates
The table below shows how much time and activity are required to burn 37.3 calories (1 cup of fish soup). The MET technique, or Metabolic Equivalent of a Task, was used to calculate this (1) (2).
| 1 cup - 70kg person | 1 cup - 100kg person | |
| Walking | 9 min | 7 min |
| Cycling | 5 min | 3 min |
| Running | 5 min | 4 min |
References

Important nutritional characteristics for Fish soup
| Calories ⓘ Calories per 100-gram serving | 16 |
| Net Carbs ⓘ Net Carbs = Total Carbohydrates – Fiber – Sugar Alcohols | 0 grams |
| Serving Size ⓘ Serving sizes are taken from FDA's Reference Amounts Customarily Consumed (RACCs) | 1 cup (233 grams) |
| Acidity (Based on PRAL) ⓘ PRAL (Potential renal acid load) is calculated using a formula. On the PRAL scale the higher the positive value, the more is the acidifying effect on the body. The lower the negative value, the higher the alkalinity of the food. 0 is neutral. | -0.1 (neutral) |
Fish soup calories (kcal)
| Serving Size | Calories | Weight |
|---|---|---|
| Calories in 100 grams | 16 | |
| Calories in 1 cup | 37 | 233 g |
Mineral coverage chart
Mineral chart - relative view
Vitamin coverage chart
Vitamin chart - relative view
Macronutrients chart
Fat type information
All nutrients for Fish soup per 100g
| Nutrient | Value | DV% | In TOP % of foods | Comparison |
| Calories | 16kcal | 1% | 98% |
2.9 times less than Orange
|
| Protein | 2.26g | 5% | 76% |
1.2 times less than Broccoli
|
| Fats | 0.81g | 1% | 76% |
41.1 times less than Cheddar Cheese
|
| Vitamin C | 0.1mg | 0% | 53% |
530 times less than Lemon
|
| Net carbs | 0g | N/A | 75% |
N/A
|
| Carbs | 0g | 0% | 100% |
N/A
|
| Cholesterol | 1mg | 0% | 58% |
373 times less than Egg
|
| Vitamin D | 0µg | 0% | 100% |
N/A
|
| Iron | 0.01mg | 0% | 97% |
260 times less than Beef broiled
|
| Calcium | 3mg | 0% | 95% |
41.7 times less than Milk
|
| Potassium | 144mg | 4% | 72% |
Equal to Cucumber
|
| Magnesium | 7mg | 2% | 89% |
20 times less than Almond
|
| Sugar | 0g | N/A | 100% |
N/A
|
| Fiber | 0g | 0% | 100% |
N/A
|
| Copper | 0.06mg | 6% | 76% |
2.4 times less than Shiitake
|
| Zinc | 0.06mg | 1% | 94% |
105.2 times less than Beef broiled
|
| Phosphorus | 56mg | 8% | 75% |
3.3 times less than Chicken meat
|
| Sodium | 156mg | 7% | 44% |
3.1 times less than White Bread
|
| Vitamin A | 6IU | 0% | 69% |
2784.3 times less than Carrot
|
| Vitamin A RAE | 2µg | 0% | 68% | |
| Vitamin E | 0.17mg | 1% | 79% |
8.6 times less than Kiwifruit
|
| Selenium | 1µg | 2% | 82% | |
| Manganese | 0.05mg | 2% | 66% | |
| Vitamin B1 | 0.03mg | 3% | 80% |
8.1 times less than Pea raw
|
| Vitamin B2 | 0.08mg | 6% | 74% |
1.7 times less than Avocado
|
| Vitamin B3 | 1.19mg | 7% | 66% |
8.1 times less than Turkey meat
|
| Vitamin B5 | 0.33mg | 7% | 71% |
3.4 times less than Sunflower seed
|
| Vitamin B6 | 0.04mg | 3% | 85% |
3.2 times less than Oat
|
| Vitamin B12 | 0.69µg | 29% | 45% |
Equal to Pork
|
| Vitamin K | 0µg | 0% | 100% |
N/A
|
| Folate | 2µg | 1% | 90% |
30.5 times less than Brussels sprout
|
| Saturated Fat | 0.2g | 1% | 77% |
29 times less than Beef broiled
|
| Monounsaturated Fat | 0.24g | N/A | 77% |
41.5 times less than Avocado
|
| Polyunsaturated fat | 0.14g | N/A | 82% |
341.8 times less than Walnut
|
| Omega-3 - EPA | 0.04g | N/A | 35% |
19.7 times less than Salmon
|
| Omega-3 - DHA | 0.05g | N/A | 36% |
29.8 times less than Salmon
|
| Omega-3 - DPA | 0.02g | N/A | 39% |
10 times less than Salmon
|
Check out similar food or compare with current
NUTRITION FACTS LABEL
Serving Size ______________
Health checks
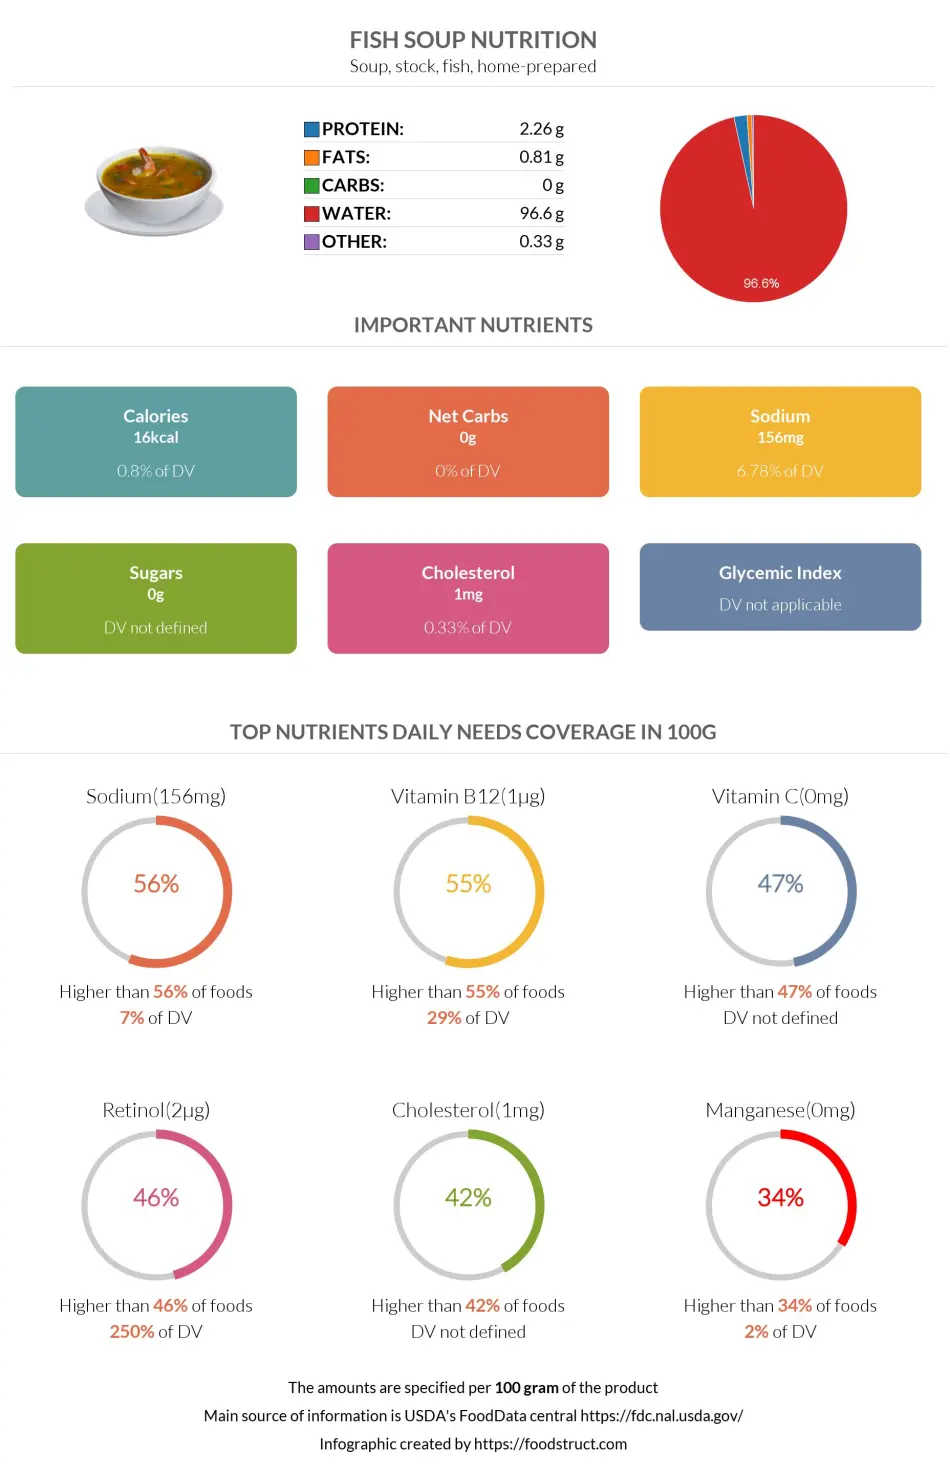
Fish soup nutrition infographic
References
All the values for which the sources are not specified explicitly are taken from FDA’s Food Central. The exact link to the food presented on this page can be found below.