Millet nutrition: calories, carbs, GI, protein, fiber, fats
Carbs in Millet
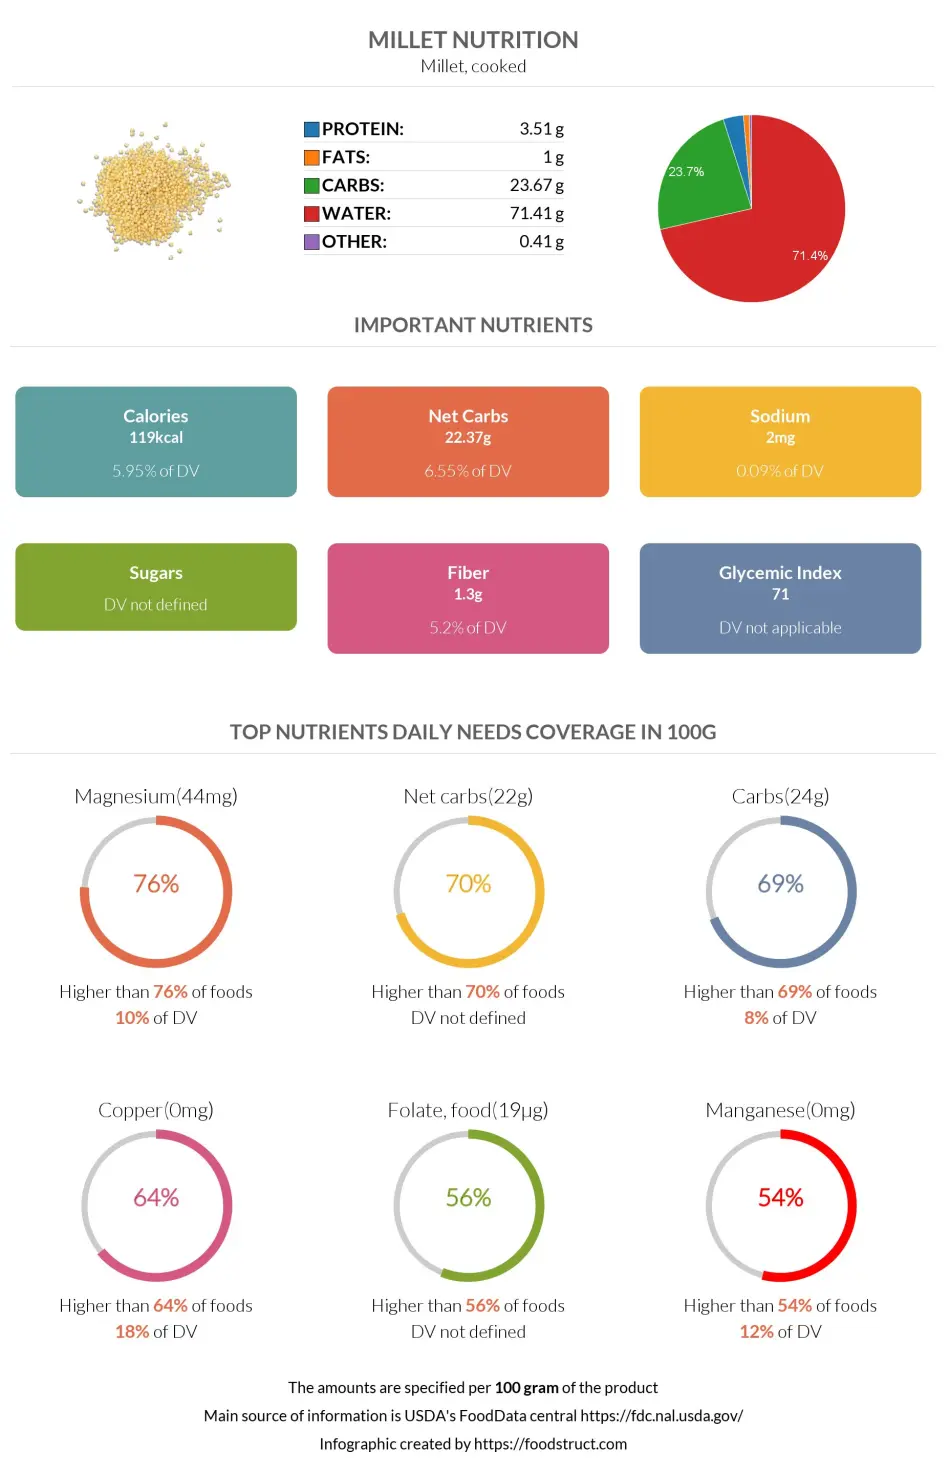
Millet can be considered a moderate-carb food. Cooked millet consists of 24% carbohydrates and 72% water. At the same time, raw millet comprises 73% carbohydrates and only 9% water.
Cooked millet falls in the top 31% of foods as a source of carbohydrates, covering only 8% of the daily need for carbs per 100g serving.
Macronutrients chart
Carbs per serving size
One average serving size of cooked millet per person is one cup, equal to about 174g.
Therefore, one average serving of millet provides 41g of carbohydrates.
Millet in Different Forms
The column below lists millet in different forms and the number of carbs they provide (per 100g) (1, 2, 3).
| Millet types | Carbs per 100g |
| Cooked millet | 23.67g |
| Raw millet | 72.8g |
| Millet flour | 75.1g |
| Puffed millet | 80g |
Millet Net Carbs
The carbohydrate content of millet consists of 94.5% net carbs and 5.5% dietary fiber.
Millet provides 22.4g of net carbs per 100g or 39g of net carbs per one cup serving.
The net carbs found in millet are made up of mainly complex carbohydrates and very few sugars.
Fiber content ratio for Millet
Soluble or Insoluble Fiber
As for the type of fiber, a study has shown over 95 % of dietary fiber in millet to be insoluble fiber, which means that millet can improve digestion and help with weight loss (4, 5).
Calories in Millet
Calories per 100g
One hundred grams of millet contains 119 calories. The main portion of these calories comes from the carb content of millet.
Calories per serving size
Millet is moderate in calories. A single serving of millet is about one cup (174 g), providing 207 calories.
Calories per type
This column shows the number of calories for different types of millet (per 100 g).
| Millet type | Calories |
| Cooked millet | 119 |
| Raw millet | 378 |
| Puffed millet | 354 |
Comparison
Foods like amaranth or couscous contain fewer calories than millet, while rice is higher in calories.
We compared millet to all foods in our database and found it is in the top 68% of foods high in calories. So only 32% of foods contain fewer calories than millet does.
| Food | Calories per 100g |
| Millet | 119 |
| White rice | 130 |
| Couscous | 112 |
| Amaranth | 102 |
Burning estimates
The table below shows the time and type of activity a person should perform to burn 207 calories (1 cup of millet), which is measured by a method called Metabolic Equivalent of a Task (6, 7).
| 70kg person | 100kg person | |
| Walking | 70min | 50min |
| Cycling | 26min | 18min |
| Running | 25min | 18min |
| Dancing | 24min | 17min |
Millet glycemic index
According to The International Tables of Glycemic Index, there are at least three forms of millet with three different glycemic indices.
Boiled millet from Canada has a glycemic index of 71±10, millet flour porridge or gruel from Kenya has a GI of 107, and finally, millet porridge from China with a GI of 62±3 (8). Based on these numbers, we have chosen 71 to represent the millet’s average GI.
A millet crop species, ragi or so-called finger millet (Eleusine coracana), has a GI of 84. The GI of roasted bread made from ragi flour is 104±13. And ragi, dehusked, soaked, stored moist, and steamed, has a GI of 68±10.
As we see, the GI in all these forms of millet foods is high, with flour’s GI being even higher than 100.
However, some studies have shown millets to positively affect glycemic control and cardiovascular factors in patients with diabetes (9).
Another group of scientists has researched the effects of cereal made from a special sort of millet, Panicum sumatrense, and found out that even after processing millet into cereal, the glycemic index, on average, stays the same (10). This quality turns millet cereal into a valuable component of a healthy diet.
References
- https://fdc.nal.usda.gov/fdc-app.html#/food-details/169702/nutrients
- https://fdc.nal.usda.gov/fdc-app.html#/food-details/167724/nutrients
- https://fdc.nal.usda.gov/fdc-app.html#/food-details/172023/nutrients
- https://www.mdpi.com/2072-6643/12/10/3045/pdf
- https://www.ncbi.nlm.nih.gov/pmc/articles/PMC3257631/
- https://www.ncbi.nlm.nih.gov/pmc/articles/PMC4428382/
- 2011 Compendium of Physical Activities
- https://academic.oup.com/ajcn/article/114/5/1625/6320814
- https://www.ncbi.nlm.nih.gov/pmc/articles/PMC5037128/
- https://www.ncbi.nlm.nih.gov/pmc/articles/PMC4554602/

Important nutritional characteristics for Millet
|
Glycemic index ⓘ
Source:
Check out our Glycemic index chart page for the full list.
|
71 (high) |
| Glycemic load | 28 (high) |
| Insulin index ⓘ II for pearl millet https://www.researchgate.net/publication/21344061 | 104 |
| Calories ⓘ Calories per 100-gram serving | 119 |
| Net Carbs ⓘ Net Carbs = Total Carbohydrates – Fiber – Sugar Alcohols | 22.37 grams |
| Serving Size ⓘ Serving sizes are taken from FDA's Reference Amounts Customarily Consumed (RACCs) | 1 cup (174 grams) |
| Acidity (Based on PRAL) ⓘ PRAL (Potential renal acid load) is calculated using a formula. On the PRAL scale the higher the positive value, the more is the acidifying effect on the body. The lower the negative value, the higher the alkalinity of the food. 0 is neutral. | 2.9 (acidic) |
| Oxalates ⓘ https://www.sciencedirect.com/science/article/abs/pii/S0889157513000902 | 13mg |
Millet calories (kcal)
| Serving Size | Calories | Weight |
|---|---|---|
| Calories in 100 grams | 119 | |
| Calories in 1 cup | 207 | 174 g |
Millet Glycemic index (GI)
Millet Glycemic load (GL)
Mineral coverage chart
Mineral chart - relative view
Vitamin coverage chart
Vitamin chart - relative view
Protein quality breakdown
Fat type information
All nutrients for Millet per 100g
| Nutrient | Value | DV% | In TOP % of foods | Comparison |
| Calories | 119kcal | 6% | 68% |
2.5 times more than Orange
|
| Protein | 3.51g | 8% | 68% |
1.2 times more than Broccoli
|
| Fats | 1g | 2% | 75% |
33.3 times less than Cheddar Cheese
|
| Vitamin C | 0mg | 0% | 100% |
N/A
|
| Net carbs | 22.37g | N/A | 30% |
2.4 times less than Chocolate
|
| Carbs | 23.67g | 8% | 31% |
1.2 times less than Rice
|
| Cholesterol | 0mg | 0% | 100% |
N/A
|
| Vitamin D | 0µg | 0% | 100% |
N/A
|
| Iron | 0.63mg | 8% | 72% |
4.1 times less than Beef broiled
|
| Calcium | 3mg | 0% | 95% |
41.7 times less than Milk
|
| Potassium | 62mg | 2% | 90% |
2.4 times less than Cucumber
|
| Magnesium | 44mg | 10% | 24% |
3.2 times less than Almond
|
| Sugar | 0.13g | N/A | 74% |
69 times less than Coca-Cola
|
| Fiber | 1.3g | 5% | 46% |
1.8 times less than Orange
|
| Copper | 0.16mg | 18% | 36% |
1.1 times more than Shiitake
|
| Zinc | 0.91mg | 8% | 55% |
6.9 times less than Beef broiled
|
| Phosphorus | 100mg | 14% | 64% |
1.8 times less than Chicken meat
|
| Sodium | 2mg | 0% | 96% |
245 times less than White Bread
|
| Vitamin A | 3IU | 0% | 72% |
5568.7 times less than Carrot
|
| Vitamin A RAE | 0µg | 0% | 100% | |
| Vitamin E | 0.02mg | 0% | 93% |
73 times less than Kiwifruit
|
| Selenium | 0.9µg | 2% | 83% | |
| Manganese | 0.27mg | 12% | 46% | |
| Vitamin B1 | 0.11mg | 9% | 46% |
2.5 times less than Pea raw
|
| Vitamin B2 | 0.08mg | 6% | 72% |
1.6 times less than Avocado
|
| Vitamin B3 | 1.33mg | 8% | 64% |
7.2 times less than Turkey meat
|
| Vitamin B5 | 0.17mg | 3% | 83% |
6.6 times less than Sunflower seed
|
| Vitamin B6 | 0.11mg | 8% | 63% |
1.1 times less than Oat
|
| Vitamin B12 | 0µg | 0% | 100% |
N/A
|
| Vitamin K | 0.3µg | 0% | 84% |
338.7 times less than Broccoli
|
| Folate | 19µg | 5% | 49% |
3.2 times less than Brussels sprout
|
| Saturated Fat | 0.17g | 1% | 78% |
34.3 times less than Beef broiled
|
| Monounsaturated Fat | 0.18g | N/A | 78% |
53.3 times less than Avocado
|
| Polyunsaturated fat | 0.51g | N/A | 61% |
92.9 times less than Walnut
|
| Tryptophan | 0.04mg | 0% | 88% |
8 times less than Chicken meat
|
| Threonine | 0.11mg | 0% | 89% |
6.4 times less than Beef broiled
|
| Isoleucine | 0.15mg | 0% | 88% |
6.2 times less than Salmon raw
|
| Leucine | 0.45mg | 0% | 83% |
5.5 times less than Tuna Bluefin
|
| Lysine | 0.07mg | 0% | 93% |
6.7 times less than Tofu
|
| Methionine | 0.07mg | 0% | 86% |
1.4 times less than Quinoa
|
| Phenylalanine | 0.19mg | 0% | 86% |
3.6 times less than Egg
|
| Valine | 0.18mg | 0% | 88% |
11 times less than Soybean raw
|
| Histidine | 0.08mg | 0% | 88% |
10 times less than Turkey meat
|
| Omega-3 - EPA | 0g | N/A | 100% |
N/A
|
| Omega-3 - DHA | 0g | N/A | 100% |
N/A
|
| Omega-3 - DPA | 0g | N/A | 100% |
N/A
|
Check out similar food or compare with current
NUTRITION FACTS LABEL
Serving Size ______________
Health checks
Millet nutrition infographic
References
All the values for which the sources are not specified explicitly are taken from FDA’s Food Central. The exact link to the food presented on this page can be found below.