Orange nutrition: calories, carbs, GI, protein, fiber, fats
Carbs in orange
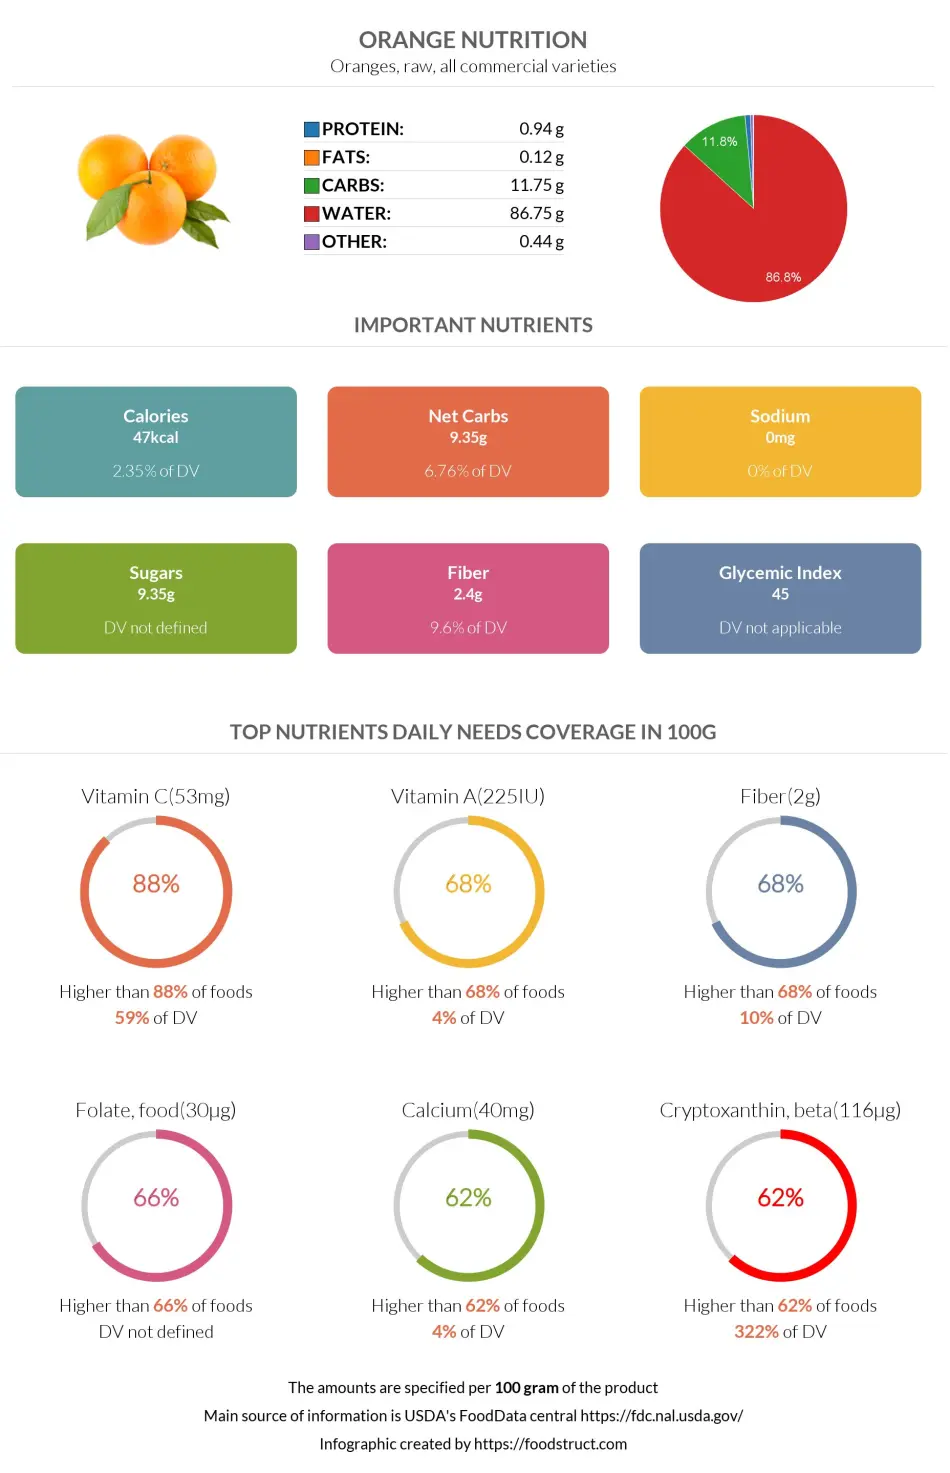
Oranges are primarily filled with water. 87% of an average commercial orange from the FDA database is water. But the carbs are in second place with 12%. Thus, 100 grams of oranges contain 12 grams of total carbs.
Your daily need for carbs is 275 per day (in the case of a standard 2000-calorie diet), so if you were on Mars and you had only oranges with you, you would need to consume 2.2 kilograms of oranges to fill your daily needs.
Macronutrients chart
Different sizes
A small oranged can be averaged to 96 grams and about 11 grams of carbs.
A really large one could have 200 grams and 24 grams of carbs.
A middle-sized orange can be averaged to have 131 grams and 15 calories.
Surely, there can be less watery ones that would definitely have more carbs in case of the same weight.
Carbohydrate type breakdown
Different types of oranges can have multiple distributions of different types of carbs. For instance, this navel orange has about 4 grams of sucrose, 2 grams of glucose, and 2 grams of fructose. It doesn’t have lactose, galactose, or starch.
Orange net carbs
If you are on a Keto diet or other low-carb diet, you might be interested in net carbs, which are basically total carbs subtracted from fiber. Why is it important? In this kind of diet, you need to consume fewer carbs, but the amount of fiber doesn’t count. So if a food is high in carbs but most of those carbs are fiber, then you don’t need to worry about it.
2.4 grams out of 11.75 grams of carbs in orange is fiber, which leaves us with 9.35 grams of Net Carbs per 100 grams.
This is visually illustrated in our carbohydrate type breakdown chart below, which shows the fiber/Non-fiber carb ratio.
Fiber content ratio for Orange
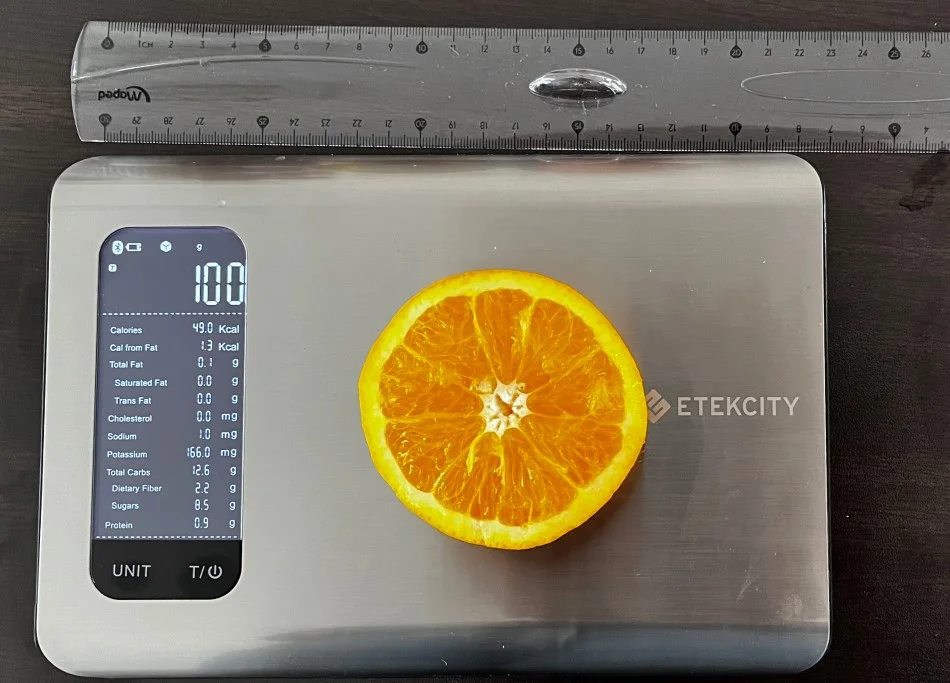
What Do 47 Calories or 100 Grams of Orange Look Like?
Our team measured what 100 grams of orange looks like to help you visualize its weight and calories. As you can see from the picture below, about half of the orange comprised 100 grams or 47-49 calories, which means one whole orange is about 200 grams or about 94-98 calories. Remember that calorie numbers can vary depending on the orange's size and ripeness.

Important nutritional characteristics for Orange
|
Glycemic index ⓘ
Source: Check out our full article on Orange glycemic index https://www.sciencedirect.com/science/article/pii/S000291652200494443 here https://www.sciencedirect.com/science/article/pii/S235261811500027X 52 in this one https://www.cabdirect.org/globalhealth/abstract/20123409459
Check out our Glycemic index chart page for the full list.
|
45 (low) |
| Glycemic load | 6 (low) |
| Insulin index ⓘ II for Navel oranges https://academic.oup.com/ajcn/article/66/5/1264/4655967 | 60 |
| Calories ⓘ Calories per 100-gram serving | 47 |
| Net Carbs ⓘ Net Carbs = Total Carbohydrates – Fiber – Sugar Alcohols | 9.35 grams |
| Serving Size ⓘ Serving sizes are taken from FDA's Reference Amounts Customarily Consumed (RACCs) | 1 fruit (2-5/8" dia) (131 grams) |
| Acidity (Based on PRAL) ⓘ PRAL (Potential renal acid load) is calculated using a formula. On the PRAL scale the higher the positive value, the more is the acidifying effect on the body. The lower the negative value, the higher the alkalinity of the food. 0 is neutral. | -3.6 (alkaline) |
| Oxalates ⓘ https://www.sciencedirect.com/science/article/abs/pii/S0308814602002121 | 2mg |
Orange calories (kcal)
| Serving Size | Calories | Weight |
|---|---|---|
| Calories in 100 grams | 47 | |
| Calories in 1 cup, sections | 85 | 180 g |
Orange Glycemic index (GI)
Orange Glycemic load (GL)
Mineral coverage chart
Mineral chart - relative view
Vitamin coverage chart
Vitamin chart - relative view
Protein quality breakdown
Fat type information
All nutrients for Orange per 100g
| Nutrient | Value | DV% | In TOP % of foods | Comparison |
| Calories | 47kcal | 2% | 88% |
Equal to Orange
|
| Protein | 0.94g | 2% | 86% |
3 times less than Broccoli
|
| Fats | 0.12g | 0% | 91% |
277.6 times less than Cheddar Cheese
|
| Vitamin C | 53.2mg | 59% | 12% |
Equal to Lemon
|
| Net carbs | 9.35g | N/A | 47% |
5.8 times less than Chocolate
|
| Carbs | 11.75g | 4% | 45% |
2.4 times less than Rice
|
| Cholesterol | 0mg | 0% | 100% |
N/A
|
| Vitamin D | 0µg | 0% | 100% |
N/A
|
| Iron | 0.1mg | 1% | 93% |
26 times less than Beef broiled
|
| Calcium | 40mg | 4% | 38% |
3.1 times less than Milk
|
| Potassium | 181mg | 5% | 64% |
1.2 times more than Cucumber
|
| Magnesium | 10mg | 2% | 84% |
14 times less than Almond
|
| Sugar | 9.35g | N/A | 40% |
Equal to Coca-Cola
|
| Fiber | 2.4g | 10% | 32% |
Equal to Orange
|
| Copper | 0.05mg | 5% | 83% |
3.2 times less than Shiitake
|
| Zinc | 0.07mg | 1% | 93% |
90.1 times less than Beef broiled
|
| Phosphorus | 14mg | 2% | 91% |
13 times less than Chicken meat
|
| Sodium | 0mg | 0% | 100% |
N/A
|
| Vitamin A | 225IU | 5% | 32% |
74.2 times less than Carrot
|
| Vitamin A RAE | 11µg | 1% | 50% | |
| Vitamin E | 0.18mg | 1% | 78% |
8.1 times less than Kiwifruit
|
| Selenium | 0.5µg | 1% | 89% | |
| Manganese | 0.03mg | 1% | 73% | |
| Vitamin B1 | 0.09mg | 7% | 53% |
3.1 times less than Pea raw
|
| Vitamin B2 | 0.04mg | 3% | 84% |
3.3 times less than Avocado
|
| Vitamin B3 | 0.28mg | 2% | 85% |
33.9 times less than Turkey meat
|
| Vitamin B5 | 0.25mg | 5% | 77% |
4.5 times less than Sunflower seed
|
| Vitamin B6 | 0.06mg | 5% | 75% |
2 times less than Oat
|
| Vitamin B12 | 0µg | 0% | 100% |
N/A
|
| Vitamin K | 0µg | 0% | 100% |
N/A
|
| Folate | 30µg | 8% | 42% |
2 times less than Brussels sprout
|
| Trans Fat | 0g | N/A | 100% |
N/A
|
| Saturated Fat | 0.02g | 0% | 92% |
393 times less than Beef broiled
|
| Monounsaturated Fat | 0.02g | N/A | 88% |
426 times less than Avocado
|
| Polyunsaturated fat | 0.03g | N/A | 93% |
1887 times less than Walnut
|
| Tryptophan | 0.01mg | 0% | 96% |
33.9 times less than Chicken meat
|
| Threonine | 0.02mg | 0% | 97% |
48 times less than Beef broiled
|
| Isoleucine | 0.03mg | 0% | 96% |
36.6 times less than Salmon raw
|
| Leucine | 0.02mg | 0% | 98% |
105.7 times less than Tuna Bluefin
|
| Lysine | 0.05mg | 0% | 95% |
9.6 times less than Tofu
|
| Methionine | 0.02mg | 0% | 93% |
4.8 times less than Quinoa
|
| Phenylalanine | 0.03mg | 0% | 96% |
21.5 times less than Egg
|
| Valine | 0.04mg | 0% | 95% |
50.7 times less than Soybean raw
|
| Histidine | 0.02mg | 0% | 96% |
41.6 times less than Turkey meat
|
| Omega-3 - EPA | 0g | N/A | 100% |
N/A
|
| Omega-3 - DHA | 0g | N/A | 100% |
N/A
|
| Omega-3 - DPA | 0g | N/A | 100% |
N/A
|
Check out similar food or compare with current
NUTRITION FACTS LABEL
Serving Size ______________
Health checks
Orange nutrition infographic
References
All the values for which the sources are not specified explicitly are taken from FDA’s Food Central. The exact link to the food presented on this page can be found below.