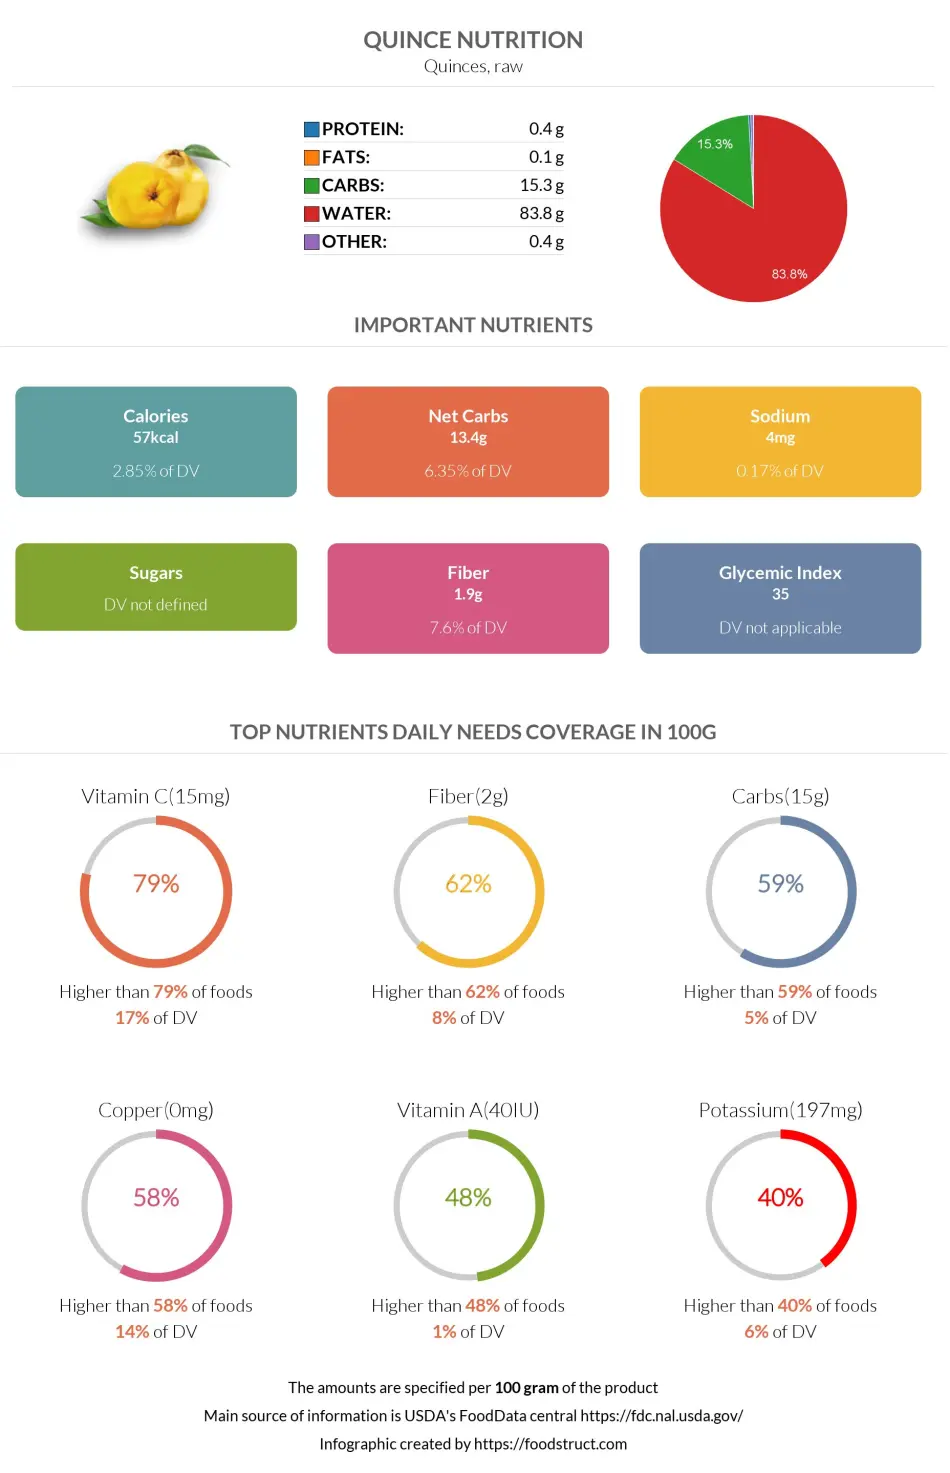
Quince nutrition: calories, carbs, GI, protein, fiber, fats

Carbs in Quince
Quince is 83.8% water and 16.2% nutrients, primarily carbs. One hundred grams of quince contains 15.3g of carbs, which covers 5% of the daily need (in the case of a 2000-calorie diet).
Carbs per serving size
The average serving size of quince is one fruit (~92g), containing 14.1g of carbs.
Carbohydrate Type Breakdown
As previously mentioned, 100g of quince contains 15.3g of carbs, 13.4g of net carbs, and 1.9g of dietary fiber.
Consequently, one fruit without refuse (serving size 92g) contains 14.1g of carbs and 1.7g of dietary fiber.
Quince net carbs
Quince is not particularly low in net carbs: 13.4g per 100g; therefore, it is preferred to avoid it during low-carb diets.
Soluble and insoluble fiber
Quince is a great source of pectin, a soluble dietary fiber used in the jam industry (1). However, the percentage of overall soluble dietary fiber in quince is not calculated yet.
Fiber content ratio for Quince
Quince Calories
Calories per 100g
Quince is a low-calorie fruit. One hundred grams of quince provides 57 calories, most of which are provided by carbs.
Macronutrients chart
Calories per serving size
The average serving size of quince is one fruit. One fruit weighing 92g provides 52.4 calories.
Comparison
Quince is in the top 16% of foods low in calories compared to all foods in our database.
The fruits mentioned below have similar nutritional content. The most visible difference in their nutritional values makes up guava's relatively high protein content.
| Food | Calories per fruit | Calories per 100g |
| Guava | 37.4 (55g) | 68 |
| Quince | 52.4 (92g) | 57 |
| Pear | 101 (medium, 178g) | 57 |
| Apple | 94.6 (medium, 182g) | 52 |
Summary table & burning estimates
We have calculated the duration and number of calories a person will burn by performing a specific type of activity, measured by a method called Met or Metabolic Equivalent of a Task (2).
The table below shows the time and type of activity a person should perform to burn 52.4 calories from one quince.
| 60kg person | 80kg person | 100kg person | |
| Walking | 15 min | 11.5 min | 9 min |
| Running | 5 min | 4 min | 3 min |
| Bicycling | 7 min | 5.5 min | 4.5 min |
| Aerobics | 7.5 min | 5.5 min | 4.5 min |
References
- https://jast.modares.ac.ir/article-23-1495-en.pdf
- https://www.ncbi.nlm.nih.gov/pmc/articles/PMC4428382/
- 2011 Compendium of Physical Activities

Important nutritional characteristics for Quince
| Glycemic index ⓘ Gi values are taken from various scientific sources. GI values less than 55 are considered as low. Values above 70 are considered as high. | 35 (low) |
| Glycemic load | 4 (low) |
| Calories ⓘ Calories per 100-gram serving | 57 |
| Net Carbs ⓘ Net Carbs = Total Carbohydrates – Fiber – Sugar Alcohols | 13.4 grams |
| Serving Size ⓘ Serving sizes are taken from FDA's Reference Amounts Customarily Consumed (RACCs) | 1 fruit without refuse (92 grams) |
| Acidity (Based on PRAL) ⓘ PRAL (Potential renal acid load) is calculated using a formula. On the PRAL scale the higher the positive value, the more is the acidifying effect on the body. The lower the negative value, the higher the alkalinity of the food. 0 is neutral. | -3.7 (alkaline) |
Quince calories (kcal)
| Serving Size | Calories | Weight |
|---|---|---|
| Calories in 100 grams | 57 | |
| Calories in 1 fruit without refuse | 52 | 92 g |
Quince Glycemic index (GI)
Quince Glycemic load (GL)
Mineral coverage chart
Mineral chart - relative view
Vitamin coverage chart
Vitamin chart - relative view
Fat type information
All nutrients for Quince per 100g
| Nutrient | Value | DV% | In TOP % of foods | Comparison |
| Calories | 57kcal | 3% | 84% |
1.2 times more than Orange
|
| Protein | 0.4g | 1% | 91% |
7.1 times less than Broccoli
|
| Fats | 0.1g | 0% | 93% |
333.1 times less than Cheddar Cheese
|
| Vitamin C | 15mg | 17% | 21% |
3.5 times less than Lemon
|
| Net carbs | 13.4g | N/A | 40% |
4 times less than Chocolate
|
| Carbs | 15.3g | 5% | 41% |
1.8 times less than Rice
|
| Cholesterol | 0mg | 0% | 100% |
N/A
|
| Iron | 0.7mg | 9% | 70% |
3.7 times less than Beef broiled
|
| Calcium | 11mg | 1% | 74% |
11.4 times less than Milk
|
| Potassium | 197mg | 6% | 60% |
1.3 times more than Cucumber
|
| Magnesium | 8mg | 2% | 87% |
17.5 times less than Almond
|
| Fiber | 1.9g | 8% | 38% |
1.3 times less than Orange
|
| Copper | 0.13mg | 14% | 42% |
1.1 times less than Shiitake
|
| Zinc | 0.04mg | 0% | 95% |
157.8 times less than Beef broiled
|
| Phosphorus | 17mg | 2% | 89% |
10.7 times less than Chicken meat
|
| Sodium | 4mg | 0% | 92% |
122.5 times less than White Bread
|
| Vitamin A | 40IU | 1% | 52% |
417.7 times less than Carrot
|
| Vitamin A RAE | 2µg | 0% | 68% | |
| Selenium | 0.6µg | 1% | 88% | |
| Vitamin B1 | 0.02mg | 2% | 88% |
13.3 times less than Pea raw
|
| Vitamin B2 | 0.03mg | 2% | 87% |
4.3 times less than Avocado
|
| Vitamin B3 | 0.2mg | 1% | 87% |
47.9 times less than Turkey meat
|
| Vitamin B5 | 0.08mg | 2% | 91% |
14 times less than Sunflower seed
|
| Vitamin B6 | 0.04mg | 3% | 83% |
3 times less than Oat
|
| Vitamin B12 | 0µg | 0% | 100% |
N/A
|
| Folate | 3µg | 1% | 87% |
20.3 times less than Brussels sprout
|
| Trans Fat | 0g | N/A | 100% |
N/A
|
| Saturated Fat | 0.01g | 0% | 93% |
589.5 times less than Beef broiled
|
| Monounsaturated Fat | 0.04g | N/A | 86% |
272.2 times less than Avocado
|
| Polyunsaturated fat | 0.05g | N/A | 90% |
943.5 times less than Walnut
|
| Omega-3 - EPA | 0g | N/A | 100% |
N/A
|
| Omega-3 - DHA | 0g | N/A | 100% |
N/A
|
| Omega-3 - DPA | 0g | N/A | 100% |
N/A
|
Check out similar food or compare with current
NUTRITION FACTS LABEL
Serving Size ______________
Health checks
Quince nutrition infographic
References
All the values for which the sources are not specified explicitly are taken from FDA’s Food Central. The exact link to the food presented on this page can be found below.