Rib Eye Steak Nutrition & Calories - Nutrients Complete data
Introduction
If you have ever wondered whether a steak is a healthy food or if it is better to avoid it, keep reading; we will discover all the nutritional aspects of rib eye steak.
Table of contents
What Is a Rib Eye Steak?
Ribeye steak, also spelled as rib eye or rib-eye steak, is a popular cut of beef known for its rich, marbled texture and excellent flavor. It is taken from the rib section of the cow, specifically from ribs six to twelve, and is located between the chuck (shoulder) and the short loin (which includes the famous T-bone and porterhouse steaks).
What sets ribeye apart is the presence of marbling, which refers to the intramuscular fat found throughout the meat. This marbling gives the ribeye its tenderness, juiciness, and distinctive beefy flavor. The central eye of meat is surrounded by a layer of fat, which enhances the flavor further during cooking.
Types of Rib Eye Steak
There are two main types of ribeye steaks:
- Bone-In Ribeye: This type of ribeye steak is cut with the bone left intact. The bone adds flavor and can help keep the meat moist while cooking. Bone-in ribeye steaks are often referred to as "cowboy steaks."
- Boneless Ribeye: As the name suggests, these steaks are cut from the ribeye roast with the bone removed. Boneless ribeye steaks are convenient for cooking and are often preferred by those who don't want to deal with bones while eating.
Nutrition
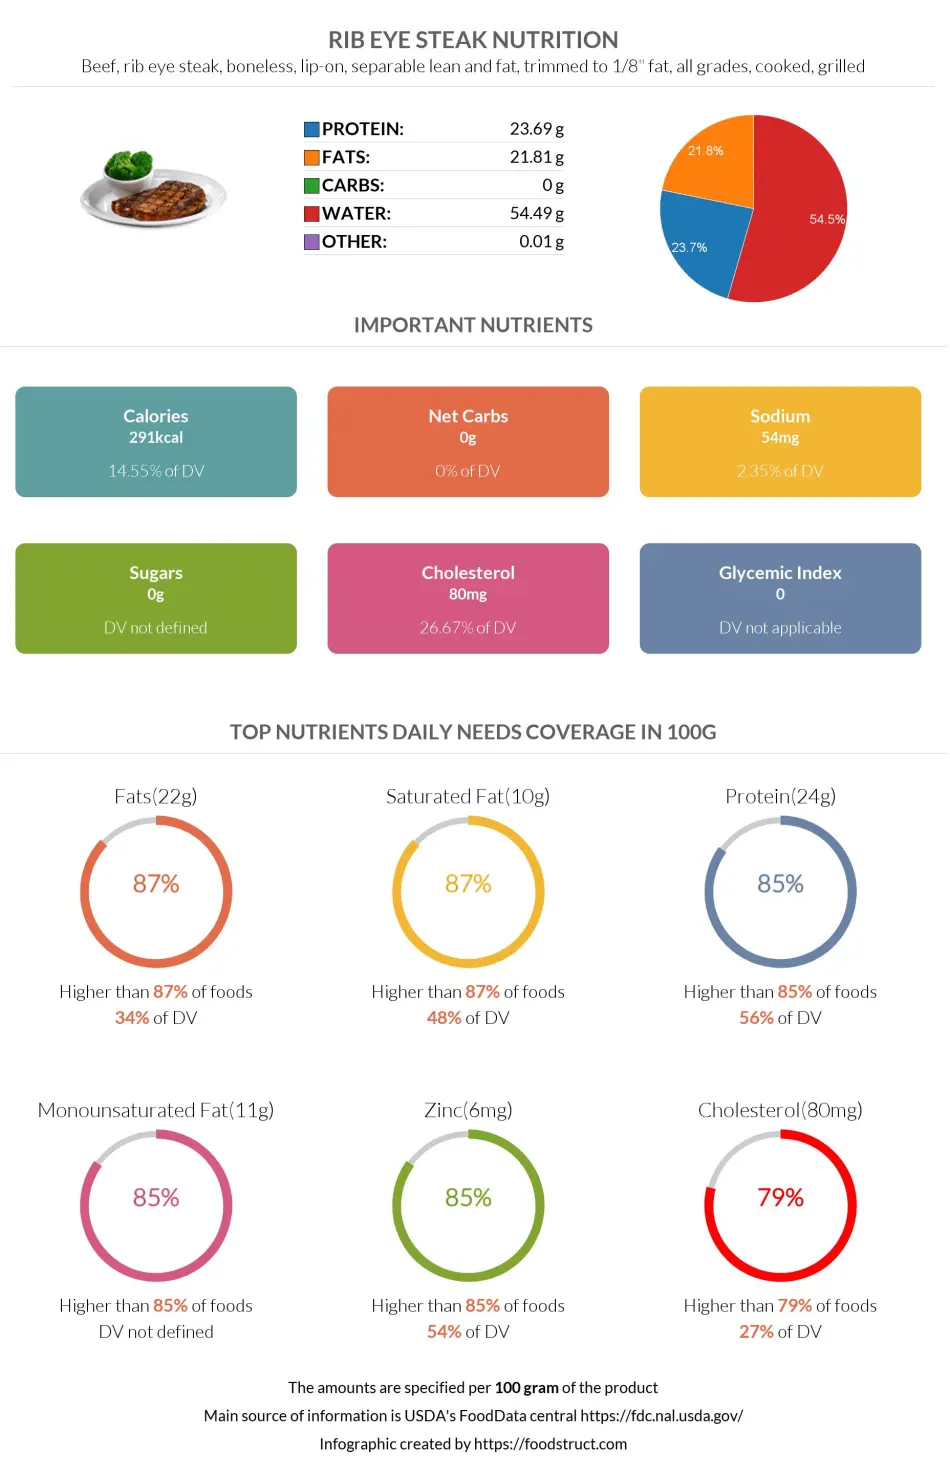
This section of the article will discuss the nutrition of rib-eye steak. The nutritional infographics below focus on a 100g serving of grilled boneless rib eye steak, lip-on, with separable lean and fat, trimmed to 1/8" fat, of all grades.
The average serving of rib eye steak per person is 3 ounces, equal to 85g, or one steak weighing around 291g.
Rib eye steak is nutritionally dense, consisting of 54% water and 46% nutrients. Of these nutrients, 24% is made up of protein and 22% is fats.
Macronutrients chart
Calories
Rib eye steak is a high-calorie food, covering 15% of the daily needed calories in just a 100g serving.
100g of ribeye steak provides 291 calories, and one average serving size (85g) provides 247 calories. One full steak (291g) provides 845 calories.
Protein
Ribeye steak is rich in protein, providing 23.69g per 100g serving. This puts rib eye steak in the top 15% of foods as a source of this nutrient, covering 56% of the daily needed protein value with just a 100g serving.
Rib eye protein is rich in essential amino acids. A 100g serving covers the daily need for threonine, lysine, and histidine. It is also a great source of tryptophan, isoleucine, phenylalanine, valine, and methionine.
Of the non-essential amino acids, rib eye steak contains high levels of arginine (1.61g), glutamic acid (3.87g), aspartic acid (2.31g), alanine (1.47g), arginine (1.61g), and glycine (1.16g).
Protein quality breakdown
Fats
Ribeye is high in fats. It falls in the top 13% of foods as a source of fats, containing 21.81g per 100g serving. Of these fats, 9.7g, or 46%, is saturated, 10.5g, or 50%, is monounsaturated, and 1.02g, or 5%, is polyunsaturated.
However, grilled rib eye steak, trimmed to 0" fat, provides 2 times fewer fats - 10.4g per 100g serving (1).
A 100g serving of rib eye steak contains 1.48g of trans fats. While this is not a high number, any amount of trans fats is considered harmful to health, leading to an increased risk of coronary artery disease (2).
Beef has been researched as a source of conjugated linoleic acid (CLA), which has been identified as having health-beneficial anticancer properties (3). CLA is a also a trans fatty acid; however, it is not the industrial trans fat but the naturally occuring form of it.
Fat type information
Cholesterol
Rib eye steak, like other steak types, is high in cholesterol. Ribeye steak falls in the top 21% of foods as a source of cholesterol, providing 80mg per 100g.
Carbohydrates
Like most types of meat, ribeye steak contains no carbohydrates.
Vitamins
Ribeye steak has a high amount of vitamin B6, vitamin B2, vitamin B12, and vitamin B3, falling approximately in the top 30% of foods as a source.
One serving of ribeye steak can cover 80% of your daily vitamin B6 need.
Ribeye steak has lower amounts of vitamin D, vitamin A, vitamin B5, vitamin B1, vitamin E, folate, and vitamin K.
Ribeye steak lacks vitamin C.
Vitamin coverage chart
Minerals
Ribeye steak has a high amount of zinc, selenium, iron, phosphorus, and potassium.
It falls in the top 15 % of foods as a source of zinc. One serving of ribeye steak can cover 54% of your daily zinc need.
Rib eye steak also contains a tiny amount of magnesium, choline, copper, manganese, and calcium.
Unsalted rib-eye steak is relatively low in sodium.
Mineral coverage chart
Glycemic Index
Based on the deficient level of carbohydrates, ribeye steak can be considered a 0 glycemic index food.
To find information about glycemic index values of over 350 foods, visit the glycemic index chart page.
Insulin Index
The insulin index of foods demonstrates how much the intake of a given food increases blood insulin levels. This value is particularly useful for foods with low carbohydrate content and glycemic index values of 0.
An insulin index value has not been calculated for rib-eye steak; however, topside lean beef steak has a value of 51 (4).
If interested, you can find the insulin index values of over 140 foods on our page.
Acidity
Rib eye steak has a PRAL or potential renal acid load value of 11.1, meaning it is an acid-producing food. The higher this value, the more acid the food produces inside the body.
Comparison of Similar Foods
We compared ribeye steak to other similar foods in our database and highlighted their main differences.
Compared with chuck steak, ribeye steak has more vitamin B6, vitamin B2, and monounsaturated fat.
Compared with beefsteak, ribeye steak provides more vitamin B2, zinc, monounsaturated and polyunsaturated fats.
Ribeye steak is richer in vitamin B12, vitamin B2, zinc, and iron than flank steak.
References
- https://fdc.nal.usda.gov/fdc-app.html#/food-details/172142/nutrients
- https://www.ncbi.nlm.nih.gov/pmc/articles/PMC8535577/
- https://www.ncbi.nlm.nih.gov/pmc/articles/PMC4771914/
- https://academic.oup.com/ajcn/article/66/5/1264/4655967

Important nutritional characteristics for Rib eye steak
|
Glycemic index ⓘ
Source: The food is assumed to have 0 or no glycemic index bason on the fact that it has no carbs and that foods with 0 carbs have no glycemic index
Check out our Glycemic index chart page for the full list.
|
0 (low) |
| Insulin index ⓘ II for topside lean beef steak https://academic.oup.com/ajcn/article/66/5/1264/4655967 | 51 |
| Calories ⓘ Calories per 100-gram serving | 291 |
| Net Carbs ⓘ Net Carbs = Total Carbohydrates – Fiber – Sugar Alcohols | 0 grams |
| Serving Size ⓘ Serving sizes are taken from FDA's Reference Amounts Customarily Consumed (RACCs) | 1 steak (291 grams) |
| Acidity (Based on PRAL) ⓘ PRAL (Potential renal acid load) is calculated using a formula. On the PRAL scale the higher the positive value, the more is the acidifying effect on the body. The lower the negative value, the higher the alkalinity of the food. 0 is neutral. | 11.1 (acidic) |
| Oxalates ⓘ Animal products do not contain oxalate. | 0mg |
Rib eye steak calories (kcal)
| Serving Size | Calories | Weight |
|---|---|---|
| Calories in 100 grams | 291 | |
| Calories in 3 oz | 247 | 85 g |
| Calories in 1 steak | 847 | 291 g |
Rib eye steak Glycemic index (GI)
Mineral chart - relative view
Vitamin chart - relative view
All nutrients for Rib eye steak per 100g
| Nutrient | Value | DV% | In TOP % of foods | Comparison |
| Calories | 291kcal | 15% | 31% |
6.2 times more than Orange
|
| Protein | 23.69g | 56% | 15% |
8.4 times more than Broccoli
|
| Fats | 21.81g | 34% | 13% |
1.5 times less than Cheddar Cheese
|
| Vitamin C | 0mg | 0% | 100% |
N/A
|
| Net carbs | 0g | N/A | 75% |
N/A
|
| Carbs | 0g | 0% | 100% |
N/A
|
| Cholesterol | 80mg | 27% | 21% |
4.7 times less than Egg
|
| Vitamin D | 0.2µg | 2% | 53% |
11 times less than Egg
|
| Iron | 2.24mg | 28% | 33% |
1.2 times less than Beef broiled
|
| Calcium | 11mg | 1% | 74% |
11.4 times less than Milk
|
| Potassium | 260mg | 8% | 46% |
1.8 times more than Cucumber
|
| Magnesium | 22mg | 5% | 54% |
6.4 times less than Almond
|
| Sugar | 0g | N/A | 100% |
N/A
|
| Fiber | 0g | 0% | 100% |
N/A
|
| Copper | 0.08mg | 9% | 63% |
1.8 times less than Shiitake
|
| Zinc | 5.91mg | 54% | 15% |
1.1 times less than Beef broiled
|
| Phosphorus | 152mg | 22% | 52% |
1.2 times less than Chicken meat
|
| Sodium | 54mg | 2% | 69% |
9.1 times less than White Bread
|
| Vitamin A | 25IU | 1% | 57% |
668.2 times less than Carrot
|
| Vitamin A RAE | 8µg | 1% | 53% | |
| Vitamin E | 0.1mg | 1% | 86% |
14.6 times less than Kiwifruit
|
| Selenium | 29.7µg | 54% | 33% | |
| Manganese | 0.08mg | 3% | 62% | |
| Vitamin B1 | 0.07mg | 6% | 60% |
3.7 times less than Pea raw
|
| Vitamin B2 | 0.29mg | 22% | 28% |
2.2 times more than Avocado
|
| Vitamin B3 | 4.91mg | 31% | 33% |
2 times less than Turkey meat
|
| Vitamin B5 | 0.54mg | 11% | 56% |
2.1 times less than Sunflower seed
|
| Vitamin B6 | 0.48mg | 37% | 26% |
4 times more than Oat
|
| Vitamin B12 | 2.1µg | 88% | 30% |
3 times more than Pork
|
| Vitamin K | 1.6µg | 1% | 70% |
63.5 times less than Broccoli
|
| Folate | 6µg | 2% | 76% |
10.2 times less than Brussels sprout
|
| Trans Fat | 1.48g | N/A | 44% |
10.1 times less than Margarine
|
| Saturated Fat | 9.68g | 48% | 13% |
1.6 times more than Beef broiled
|
| Monounsaturated Fat | 10.52g | N/A | 15% |
1.1 times more than Avocado
|
| Polyunsaturated fat | 1.03g | N/A | 45% |
45.9 times less than Walnut
|
| Tryptophan | 0.27mg | 0% | 54% |
1.2 times less than Chicken meat
|
| Threonine | 1.12mg | 0% | 52% |
1.6 times more than Beef broiled
|
| Isoleucine | 1.1mg | 0% | 55% |
1.2 times more than Salmon raw
|
| Leucine | 2.04mg | 0% | 53% |
1.2 times less than Tuna Bluefin
|
| Lysine | 2.27mg | 0% | 51% |
5 times more than Tofu
|
| Methionine | 0.64mg | 0% | 55% |
6.7 times more than Quinoa
|
| Phenylalanine | 0.95mg | 0% | 56% |
1.4 times more than Egg
|
| Valine | 1.18mg | 0% | 55% |
1.7 times less than Soybean raw
|
| Histidine | 0.89mg | 0% | 50% |
1.2 times more than Turkey meat
|
| Omega-3 - EPA | 0g | N/A | 51% |
690 times less than Salmon
|
| Omega-3 - DHA | 0g | N/A | 51% |
1460 times less than Salmon
|
| Omega-3 - ALA | 0.04g | N/A | 91% |
240.5 times less than Canola oil
|
| Omega-3 - DPA | 0.01g | N/A | 41% |
12.1 times less than Salmon
|
| Omega-6 - Dihomo-gamma-linoleic acid | 0.02g | N/A | 87% | |
| Omega-6 - Eicosadienoic acid | 0.01g | N/A | 82% | |
| Omega-6 - Linoleic acid | 0.7g | N/A | 88% |
17.6 times less than Almond
|
Check out similar food or compare with current
NUTRITION FACTS LABEL
Serving Size ______________
Health checks
Rib eye steak nutrition infographic
References
All the values for which the sources are not specified explicitly are taken from FDA’s Food Central. The exact link to the food presented on this page can be found below.