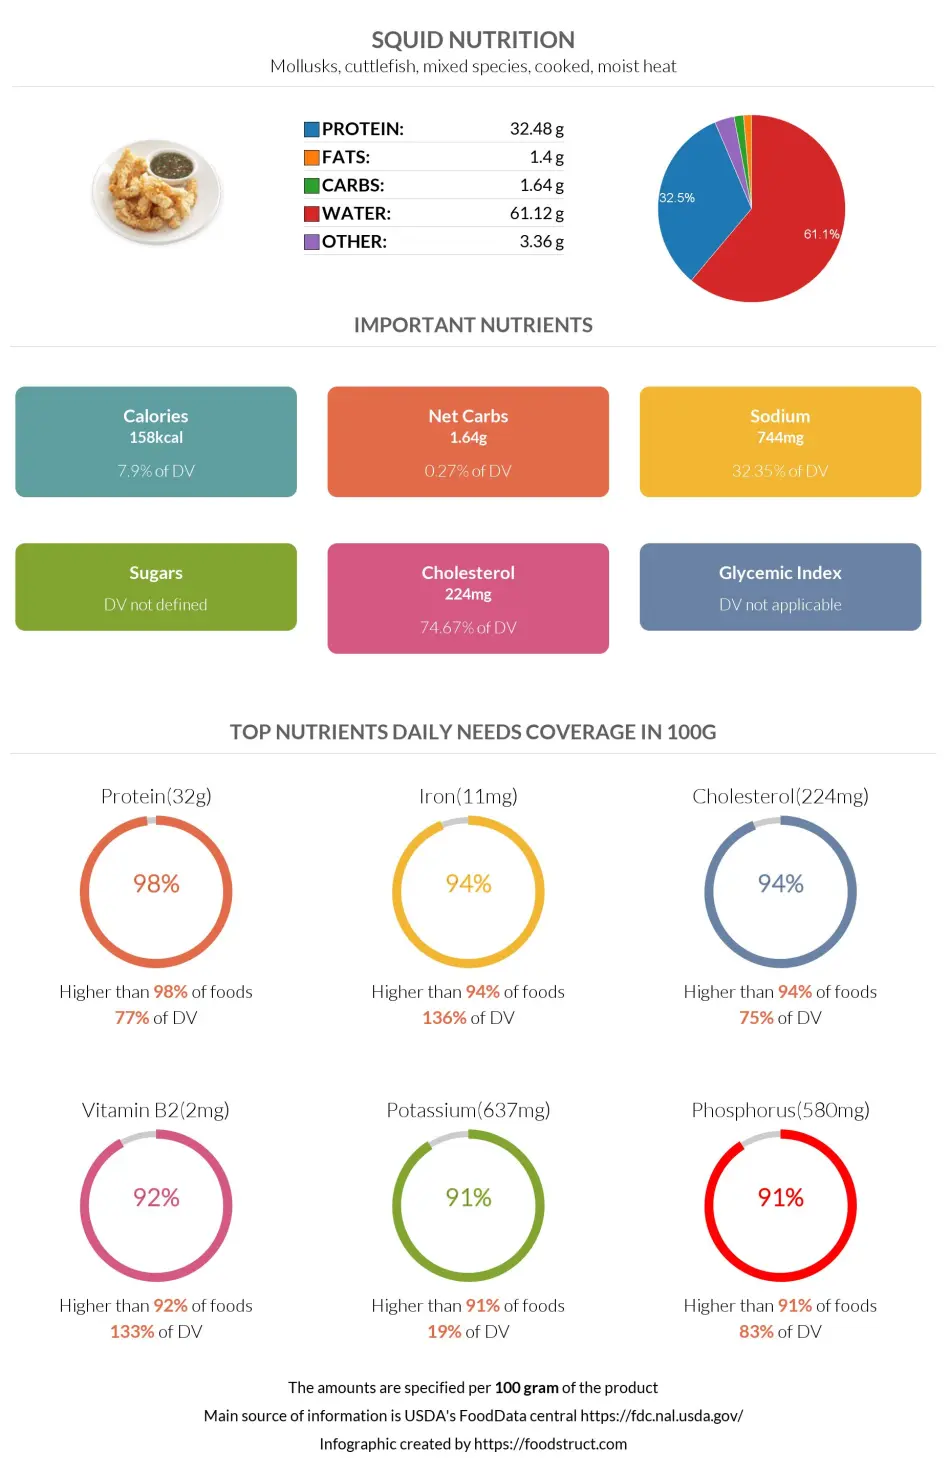
Squid nutrition: calories, carbs, GI, protein, fiber, fats
Mollusks, cuttlefish, mixed species, cooked, moist heat
*all the values are displayed for the amount of 100 grams
Important nutritional characteristics for Squid
| Calories ⓘ Calories per 100-gram serving | 158 |
| Net Carbs ⓘ Net Carbs = Total Carbohydrates – Fiber – Sugar Alcohols | 1.64 grams |
| Serving Size ⓘ Serving sizes are taken from FDA's Reference Amounts Customarily Consumed (RACCs) | 3 oz (85 grams) |
| Acidity (Based on PRAL) ⓘ PRAL (Potential renal acid load) is calculated using a formula. On the PRAL scale the higher the positive value, the more is the acidifying effect on the body. The lower the negative value, the higher the alkalinity of the food. 0 is neutral. | 20.1 (acidic) |
Protein ⓘHigher in Protein content than 98% of foods
Iron ⓘHigher in Iron content than 94% of foods
Cholesterol ⓘHigher in Cholesterol content than 94% of foods
Vitamin B2 ⓘHigher in Vitamin B2 content than 92% of foods
Potassium ⓘHigher in Potassium content than 91% of foods
Squid calories (kcal)
| Serving Size | Calories | Weight |
|---|---|---|
| Calories in 100 grams | 158 | |
| Calories in 3 oz | 134 | 85 g |
Mineral coverage chart
Calcium:
180 mg of 1,000 mg
18%
Iron:
10.84 mg of 8 mg
136%
Magnesium:
60 mg of 420 mg
14%
Phosphorus:
580 mg of 700 mg
83%
Potassium:
637 mg of 3,400 mg
19%
Sodium:
744 mg of 2,300 mg
32%
Zinc:
3.46 mg of 11 mg
31%
Copper:
0.998 mg of 1 mg
111%
Manganese:
0.209 mg of 2 mg
9%
Selenium:
89.6 µg of 55 µg
163%
Choline:
0 mg of 550 mg
0%
Mineral chart - relative view
Iron
10.84 mg
TOP 6%
Phosphorus
580 mg
TOP 9%
Potassium
637 mg
TOP 9%
Sodium
744 mg
TOP 10%
Calcium
180 mg
TOP 13%
Copper
0.998 mg
TOP 17%
Magnesium
60 mg
TOP 19%
Selenium
89.6 µg
TOP 20%
Zinc
3.46 mg
TOP 27%
Manganese
0.209 mg
TOP 51%
Vitamin coverage chart
Vitamin A:
675 IU of 5,000 IU
14%
Vitamin E :
0 mg of 15 mg
0%
Vitamin D:
0 µg of 10 µg
0%
Vitamin C:
8.5 mg of 90 mg
9%
Vitamin B1:
0.017 mg of 1 mg
1%
Vitamin B2:
1.729 mg of 1 mg
133%
Vitamin B3:
2.189 mg of 16 mg
14%
Vitamin B5:
0.9 mg of 5 mg
18%
Vitamin B6:
0.27 mg of 1 mg
21%
Folate:
24 µg of 400 µg
6%
Vitamin B12:
5.4 µg of 2 µg
225%
Vitamin K:
0 µg of 120 µg
0%
Vitamin chart - relative view
Vitamin B2
1.729 mg
TOP 8%
Vitamin B12
5.4 µg
TOP 17%
Vitamin A
675 IU
TOP 22%
Vitamin C
8.5 mg
TOP 25%
Vitamin B5
0.9 mg
TOP 38%
Vitamin B6
0.27 mg
TOP 43%
Folate
24 µg
TOP 45%
Vitamin B3
2.189 mg
TOP 57%
Vitamin B1
0.017 mg
TOP 89%
Macronutrients chart
Protein:
Daily Value: 65%
32.48 g of 50 g
65%
Fats:
Daily Value: 2%
1.4 g of 65 g
2%
Carbs:
Daily Value: 1%
1.64 g of 300 g
1%
Water:
Daily Value: 3%
61.12 g of 2,000 g
3%
Other:
3.36 g
Protein quality breakdown
Tryptophan:
364 mg of 280 mg
130%
Threonine:
1398 mg of 1,050 mg
133%
Isoleucine:
1414 mg of 1,400 mg
101%
Leucine:
2287 mg of 2,730 mg
84%
Lysine:
2427 mg of 2,100 mg
116%
Methionine:
733 mg of 1,050 mg
70%
Phenylalanine:
1164 mg of 1,750 mg
67%
Valine:
1419 mg of 1,820 mg
78%
Histidine:
624 mg of 700 mg
89%
Fat type information
Saturated Fat:
0.236 g
Monounsaturated Fat:
0.162 g
Polyunsaturated fat:
0.268 g
All nutrients for Squid per 100g
| Nutrient | Value | DV% | In TOP % of foods | Comparison |
| Calories | 158kcal | 8% | 57% |
3.4 times more than Orange
|
| Protein | 32.48g | 77% | 2% |
11.5 times more than Broccoli
|
| Fats | 1.4g | 2% | 72% |
23.8 times less than Cheddar Cheese
|
| Vitamin C | 8.5mg | 9% | 25% |
6.2 times less than Lemon
|
| Net carbs | 1.64g | N/A | 67% |
33 times less than Chocolate
|
| Carbs | 1.64g | 1% | 68% |
17.2 times less than Rice
|
| Cholesterol | 224mg | 75% | 6% |
1.7 times less than Egg
|
| Iron | 10.84mg | 136% | 6% |
4.2 times more than Beef broiled
|
| Calcium | 180mg | 18% | 13% |
1.4 times more than Milk
|
| Potassium | 637mg | 19% | 9% |
4.3 times more than Cucumber
|
| Magnesium | 60mg | 14% | 19% |
2.3 times less than Almond
|
| Fiber | 0g | 0% | 100% |
N/A
|
| Copper | 1mg | 111% | 17% |
7 times more than Shiitake
|
| Zinc | 3.46mg | 31% | 27% |
1.8 times less than Beef broiled
|
| Phosphorus | 580mg | 83% | 9% |
3.2 times more than Chicken meat
|
| Sodium | 744mg | 32% | 10% |
1.5 times more than White Bread
|
| Vitamin A | 675IU | 14% | 22% |
24.7 times less than Carrot
|
| Vitamin A RAE | 203µg | 23% | 25% | |
| Selenium | 89.6µg | 163% | 20% | |
| Manganese | 0.21mg | 9% | 51% | |
| Vitamin B1 | 0.02mg | 1% | 89% |
15.6 times less than Pea raw
|
| Vitamin B2 | 1.73mg | 133% | 8% |
13.3 times more than Avocado
|
| Vitamin B3 | 2.19mg | 14% | 57% |
4.4 times less than Turkey meat
|
| Vitamin B5 | 0.9mg | 18% | 38% |
1.3 times less than Sunflower seed
|
| Vitamin B6 | 0.27mg | 21% | 43% |
2.3 times more than Oat
|
| Vitamin B12 | 5.4µg | 225% | 17% |
7.7 times more than Pork
|
| Folate | 24µg | 6% | 45% |
2.5 times less than Brussels sprout
|
| Saturated Fat | 0.24g | 1% | 75% |
25 times less than Beef broiled
|
| Monounsaturated Fat | 0.16g | N/A | 79% |
60.5 times less than Avocado
|
| Polyunsaturated fat | 0.27g | N/A | 74% |
176 times less than Walnut
|
| Tryptophan | 0.36mg | 0% | 44% |
1.2 times more than Chicken meat
|
| Threonine | 1.4mg | 0% | 44% |
1.9 times more than Beef broiled
|
| Isoleucine | 1.41mg | 0% | 45% |
1.5 times more than Salmon raw
|
| Leucine | 2.29mg | 0% | 47% |
1.1 times less than Tuna Bluefin
|
| Lysine | 2.43mg | 0% | 48% |
5.4 times more than Tofu
|
| Methionine | 0.73mg | 0% | 49% |
7.6 times more than Quinoa
|
| Phenylalanine | 1.16mg | 0% | 47% |
1.7 times more than Egg
|
| Valine | 1.42mg | 0% | 48% |
1.4 times less than Soybean raw
|
| Histidine | 0.62mg | 0% | 63% |
1.2 times less than Turkey meat
|
| Omega-3 - EPA | 0.08g | N/A | 34% |
8.8 times less than Salmon
|
| Omega-3 - DHA | 0.13g | N/A | 35% |
11.1 times less than Salmon
|
| Omega-3 - DPA | 0.01g | N/A | 42% |
14.2 times less than Salmon
|
Check out similar food or compare with current
NUTRITION FACTS LABEL
Nutrition Facts
___servings per container
Serving Size ______________
Serving Size ______________
Amount Per 100g
Calories 158
% Daily Value*
2%
Total Fat
1g
0%
Saturated Fat 0g
75%
Cholesterol 224mg
32%
Sodium 744mg
1%
Total Carbohydrate
2g
0%
Dietary Fiber
0g
Total Sugars g
Includes ? g Added Sugars
Protein
32g
Vitamin D
0mcg
0%
Calcium
180mg
18%
Iron
11mg
138%
Potassium
637mg
19%
*
The % Daily Value (DV) tells you how much a nutrient in a serving of food contributes to a daily diet. 2,000 calories a day is used for general nutrition advice.
Health checks
Low in Cholesterol
ⓘ
Dietary cholesterol is not associated with an increased risk of coronary heart disease in healthy individuals. However, dietary cholesterol is common in foods that are high in harmful saturated fats.
Source
No Trans Fats
ⓘ
Trans fat consumption increases the risk of cardiovascular disease and mortality by negatively affecting blood lipid levels.
Source
Low in Saturated Fats
ⓘ
Saturated fat intake can raise total cholesterol and LDL (low-density lipoprotein) levels, leading to an increased risk of atherosclerosis. Dietary guidelines recommend limiting saturated fats to under 10% of calories a day.
Source
Low in Sugars
ⓘ
While the consumption of moderate amounts of added sugars is not detrimental to health, an excessive intake can increase the risk of obesity, and therefore, diabetes.
Source
Squid nutrition infographic
Infographic link
References
All the values for which the sources are not specified explicitly are taken from FDA’s Food Central. The exact link to the food presented on this page can be found below.