Turmeric nutrition: calories, carbs, GI, protein, fiber, fats
Carbs in turmeric
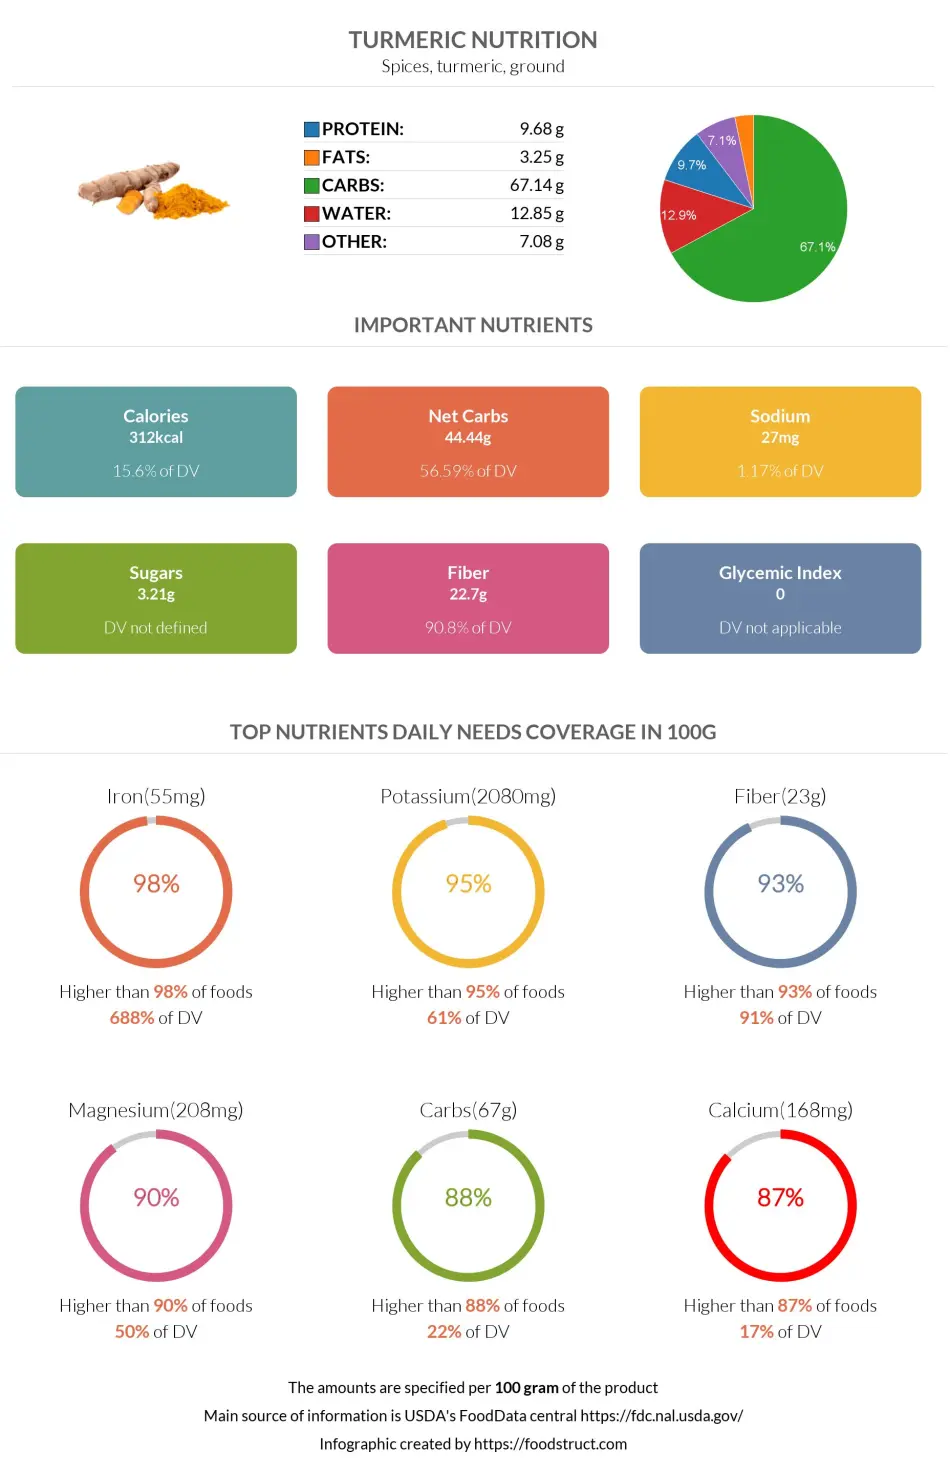
Turmeric contains 67g of carbs per 100g, 23g of them are fiber, and the rest, 44g, are net carbs.
However, the whole picture changes because people usually consume a tiny amount of turmeric.
Macronutrients chart
Carbs per serving size
The serving size of turmeric is usually around 0.5 - 2 grams, which provides 0.3 -1.2 grams of carbohydrates accordingly.
Even though people usually consume a tiny amount of turmeric, high doses are not recommended long-term.
Different types
The column below lists turmeric dishes and the number of carbs they provide.
| Dishes | Turmeric | Crabs |
| Turmeric Tea | One teaspoon ground turmeric (2g) | 1.35g |
| Salad dressing | One teaspoon of turmeric (2g) | 1.35g |
| Coconut golden milk | Two teaspoons turmeric (4g) | 2.7g |
| Curry | ½ teaspoon turmeric (1g) | 0.67g |
| Vegetable curry | ½ teaspoon turmeric (1g) | 0.67g |
Carbohydrate type breakdown
Carbohydrate type breakdown
The chart above shows that turmeric lacks starch.
Turmeric contains a relatively high amount of sucrose: 2.38 grams, whereas glucose and fructose are low.
Turmeric net carbs
Turmeric contains a high amount of net carbs. In tiny amounts, such as tablespoons, turmeric offers 2 grams of fiber, which is only 10% of your daily fiber intake.
Of the 67.14 grams of turmeric carbs, 22.7 grams is fiber; the rest is net carbohydrates.
Calories per 100g
One hundred grams of turmeric provides 312 calories. The majority of these calories come from the carb content of turmeric.
Although turmeric has a high amount of carbs, it has a small number of sugars: 3.21 g per 100 grams.
Calories per serving size
People often consume turmeric in quantities smaller than 100 grams. Usually, the serving size is 0.25 teaspoons, which contains 0.5 grams of turmeric and 1.56 calories accordingly.
Comparison
Foods like cumin or curry powder contain more calories than turmeric.
We compared turmeric to all foods in our database and found it is in the top 28% of foods high in calories. So, 72% of foods contain fewer calories than turmeric.
| Food | Calories per 100 grams |
| Cumin | 375 |
| Curry powder | 325 |
| Turmeric | 312 |
| Saffron | 310 |
| Ginger | 80 |

Important nutritional characteristics for Turmeric
|
Glycemic index ⓘ
Source: 83 with glucose (glucose 100) http://www.als-journal.com/712-19/ 85 with glucose (glucose 97) https://www.ncbi.nlm.nih.gov/pmc/articles/PMC5897315/ May not affect GI https://www.ncbi.nlm.nih.gov/pmc/articles/PMC2964546/
Check out our Glycemic index chart page for the full list.
|
0 (low) |
| Calories ⓘ Calories per 100-gram serving | 312 |
| Net Carbs ⓘ Net Carbs = Total Carbohydrates – Fiber – Sugar Alcohols | 44.44 grams |
| Serving Size ⓘ Serving sizes are taken from FDA's Reference Amounts Customarily Consumed (RACCs) | 0.25 tsp (0.5 grams) |
| Acidity (Based on PRAL) ⓘ PRAL (Potential renal acid load) is calculated using a formula. On the PRAL scale the higher the positive value, the more is the acidifying effect on the body. The lower the negative value, the higher the alkalinity of the food. 0 is neutral. | -35.5 (alkaline) |
| Oxalates ⓘ https://www.researchgate.net/publication/223973698 | 1889mg |
Turmeric calories (kcal)
| Serving Size | Calories | Weight |
|---|---|---|
| Calories in 100 grams | 312 | |
| Calories in 0.25 tsp | 2 | 0.5 g |
| Calories in 1 tbsp | 29 | 9.4 g |
Turmeric Glycemic index (GI)
Mineral coverage chart
Mineral chart - relative view
Vitamin coverage chart
Vitamin chart - relative view
Protein quality breakdown
Fat type information
Fiber content ratio for Turmeric
All nutrients for Turmeric per 100g
| Nutrient | Value | DV% | In TOP % of foods | Comparison |
| Calories | 312kcal | 16% | 28% |
6.6 times more than Orange
|
| Protein | 9.68g | 23% | 45% |
3.4 times more than Broccoli
|
| Fats | 3.25g | 5% | 60% |
10.2 times less than Cheddar Cheese
|
| Vitamin C | 0.7mg | 1% | 45% |
75.7 times less than Lemon
|
| Net carbs | 44.44g | N/A | 21% |
1.2 times less than Chocolate
|
| Carbs | 67.14g | 22% | 12% |
2.4 times more than Rice
|
| Cholesterol | 0mg | 0% | 100% |
N/A
|
| Vitamin D | 0µg | 0% | 100% |
N/A
|
| Iron | 55mg | 688% | 2% |
21.2 times more than Beef broiled
|
| Calcium | 168mg | 17% | 13% |
1.3 times more than Milk
|
| Potassium | 2080mg | 61% | 5% |
14.1 times more than Cucumber
|
| Magnesium | 208mg | 50% | 10% |
1.5 times more than Almond
|
| Sugar | 3.21g | N/A | 54% |
2.8 times less than Coca-Cola
|
| Fiber | 22.7g | 91% | 7% |
9.5 times more than Orange
|
| Copper | 1.3mg | 144% | 16% |
9.2 times more than Shiitake
|
| Zinc | 4.5mg | 41% | 21% |
1.4 times less than Beef broiled
|
| Phosphorus | 299mg | 43% | 17% |
1.6 times more than Chicken meat
|
| Sodium | 27mg | 1% | 79% |
18.1 times less than White Bread
|
| Vitamin A | 0IU | 0% | 100% |
N/A
|
| Vitamin A RAE | 0µg | 0% | 100% | |
| Vitamin E | 4.43mg | 30% | 37% |
3 times more than Kiwifruit
|
| Selenium | 6.2µg | 11% | 65% | |
| Manganese | 19.8mg | 861% | 25% | |
| Vitamin B1 | 0.06mg | 5% | 68% |
4.6 times less than Pea raw
|
| Vitamin B2 | 0.15mg | 12% | 58% |
1.2 times more than Avocado
|
| Vitamin B3 | 1.35mg | 8% | 64% |
7.1 times less than Turkey meat
|
| Vitamin B5 | 0.54mg | 11% | 56% |
2.1 times less than Sunflower seed
|
| Vitamin B6 | 0.11mg | 8% | 63% |
1.1 times less than Oat
|
| Vitamin B12 | 0µg | 0% | 100% |
N/A
|
| Vitamin K | 13.4µg | 11% | 49% |
7.6 times less than Broccoli
|
| Folate | 20µg | 5% | 48% |
3.1 times less than Brussels sprout
|
| Trans Fat | 0.06g | N/A | 66% |
265.9 times less than Margarine
|
| Saturated Fat | 1.84g | 9% | 49% |
3.2 times less than Beef broiled
|
| Monounsaturated Fat | 0.45g | N/A | 72% |
21.8 times less than Avocado
|
| Polyunsaturated fat | 0.76g | N/A | 52% |
62.4 times less than Walnut
|
| Tryptophan | 0.17mg | 0% | 69% |
1.8 times less than Chicken meat
|
| Threonine | 0.33mg | 0% | 77% |
2.2 times less than Beef broiled
|
| Isoleucine | 0.47mg | 0% | 75% |
1.9 times less than Salmon raw
|
| Leucine | 0.81mg | 0% | 76% |
3 times less than Tuna Bluefin
|
| Lysine | 0.38mg | 0% | 78% |
1.2 times less than Tofu
|
| Methionine | 0.14mg | 0% | 80% |
1.5 times more than Quinoa
|
| Phenylalanine | 0.53mg | 0% | 74% |
1.3 times less than Egg
|
| Valine | 0.66mg | 0% | 72% |
3.1 times less than Soybean raw
|
| Histidine | 0.15mg | 0% | 82% |
5 times less than Turkey meat
|
| Fructose | 0.45g | 1% | 89% |
13.1 times less than Apple
|
| Omega-3 - EPA | 0g | N/A | 100% |
N/A
|
| Omega-3 - DHA | 0g | N/A | 100% |
N/A
|
| Omega-3 - ALA | 0g | N/A | 99% |
3046.7 times less than Canola oil
|
| Omega-3 - DPA | 0g | N/A | 100% |
N/A
|
| Omega-6 - Gamma-linoleic acid | 0.08g | N/A | 81% | |
| Omega-6 - Eicosadienoic acid | 0g | N/A | 100% |
Check out similar food or compare with current

NUTRITION FACTS LABEL
Serving Size ______________
Health checks
Turmeric nutrition infographic
References
All the values for which the sources are not specified explicitly are taken from FDA’s Food Central. The exact link to the food presented on this page can be found below.