Lettuce Nutrition & Calories – Complete Data of All Nutrients
Introduction
Lettuce is a versatile leafy green vegetable used in salads and various dishes across the globe. It adds freshness and crunch to your meals while providing various nutrients that contribute to overall health and well-being. This article will provide a detailed nutritional breakdown of lettuce and explore its various macronutrients and phytochemicals.
Table of contents
Nutrition
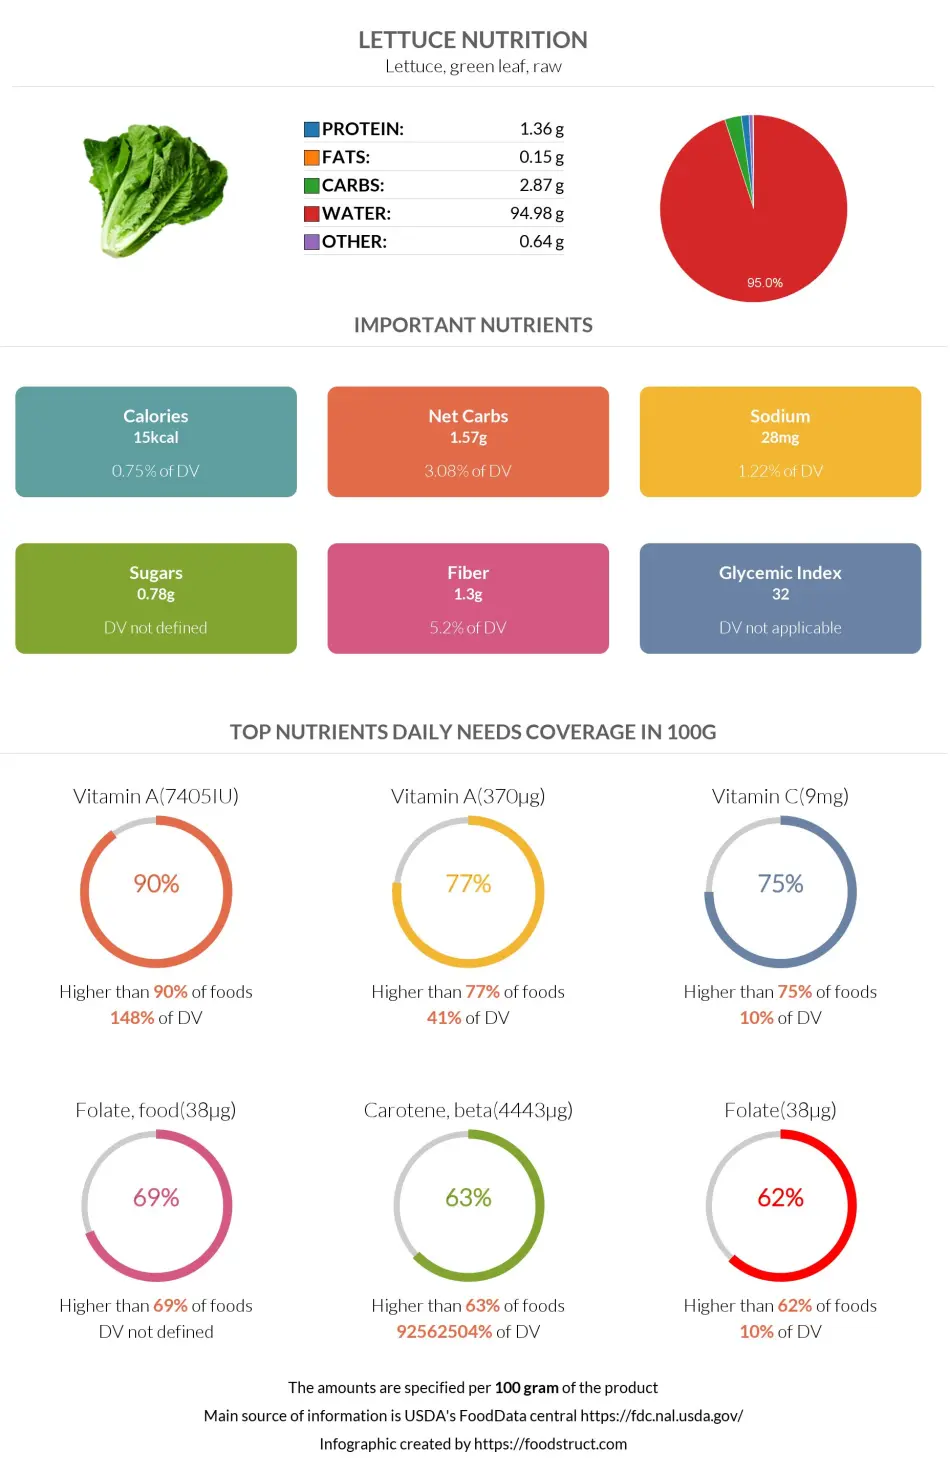
The nutritional values below are presented for green leaf raw lettuce. As with most vegetables, lettuce is composed primarily of water; around 95% of its entire composition is water. It also contains small amounts of carbs and protein.
The serving size of lettuce is equal to one cup, which corresponds to 36 grams.
Macronutrients chart
Calories
Lettuce is considered a low-calorie food, containing only 15 calories per 100-gram serving. Per one standard serving (36 grams), lettuce provides only 5.4 calories.
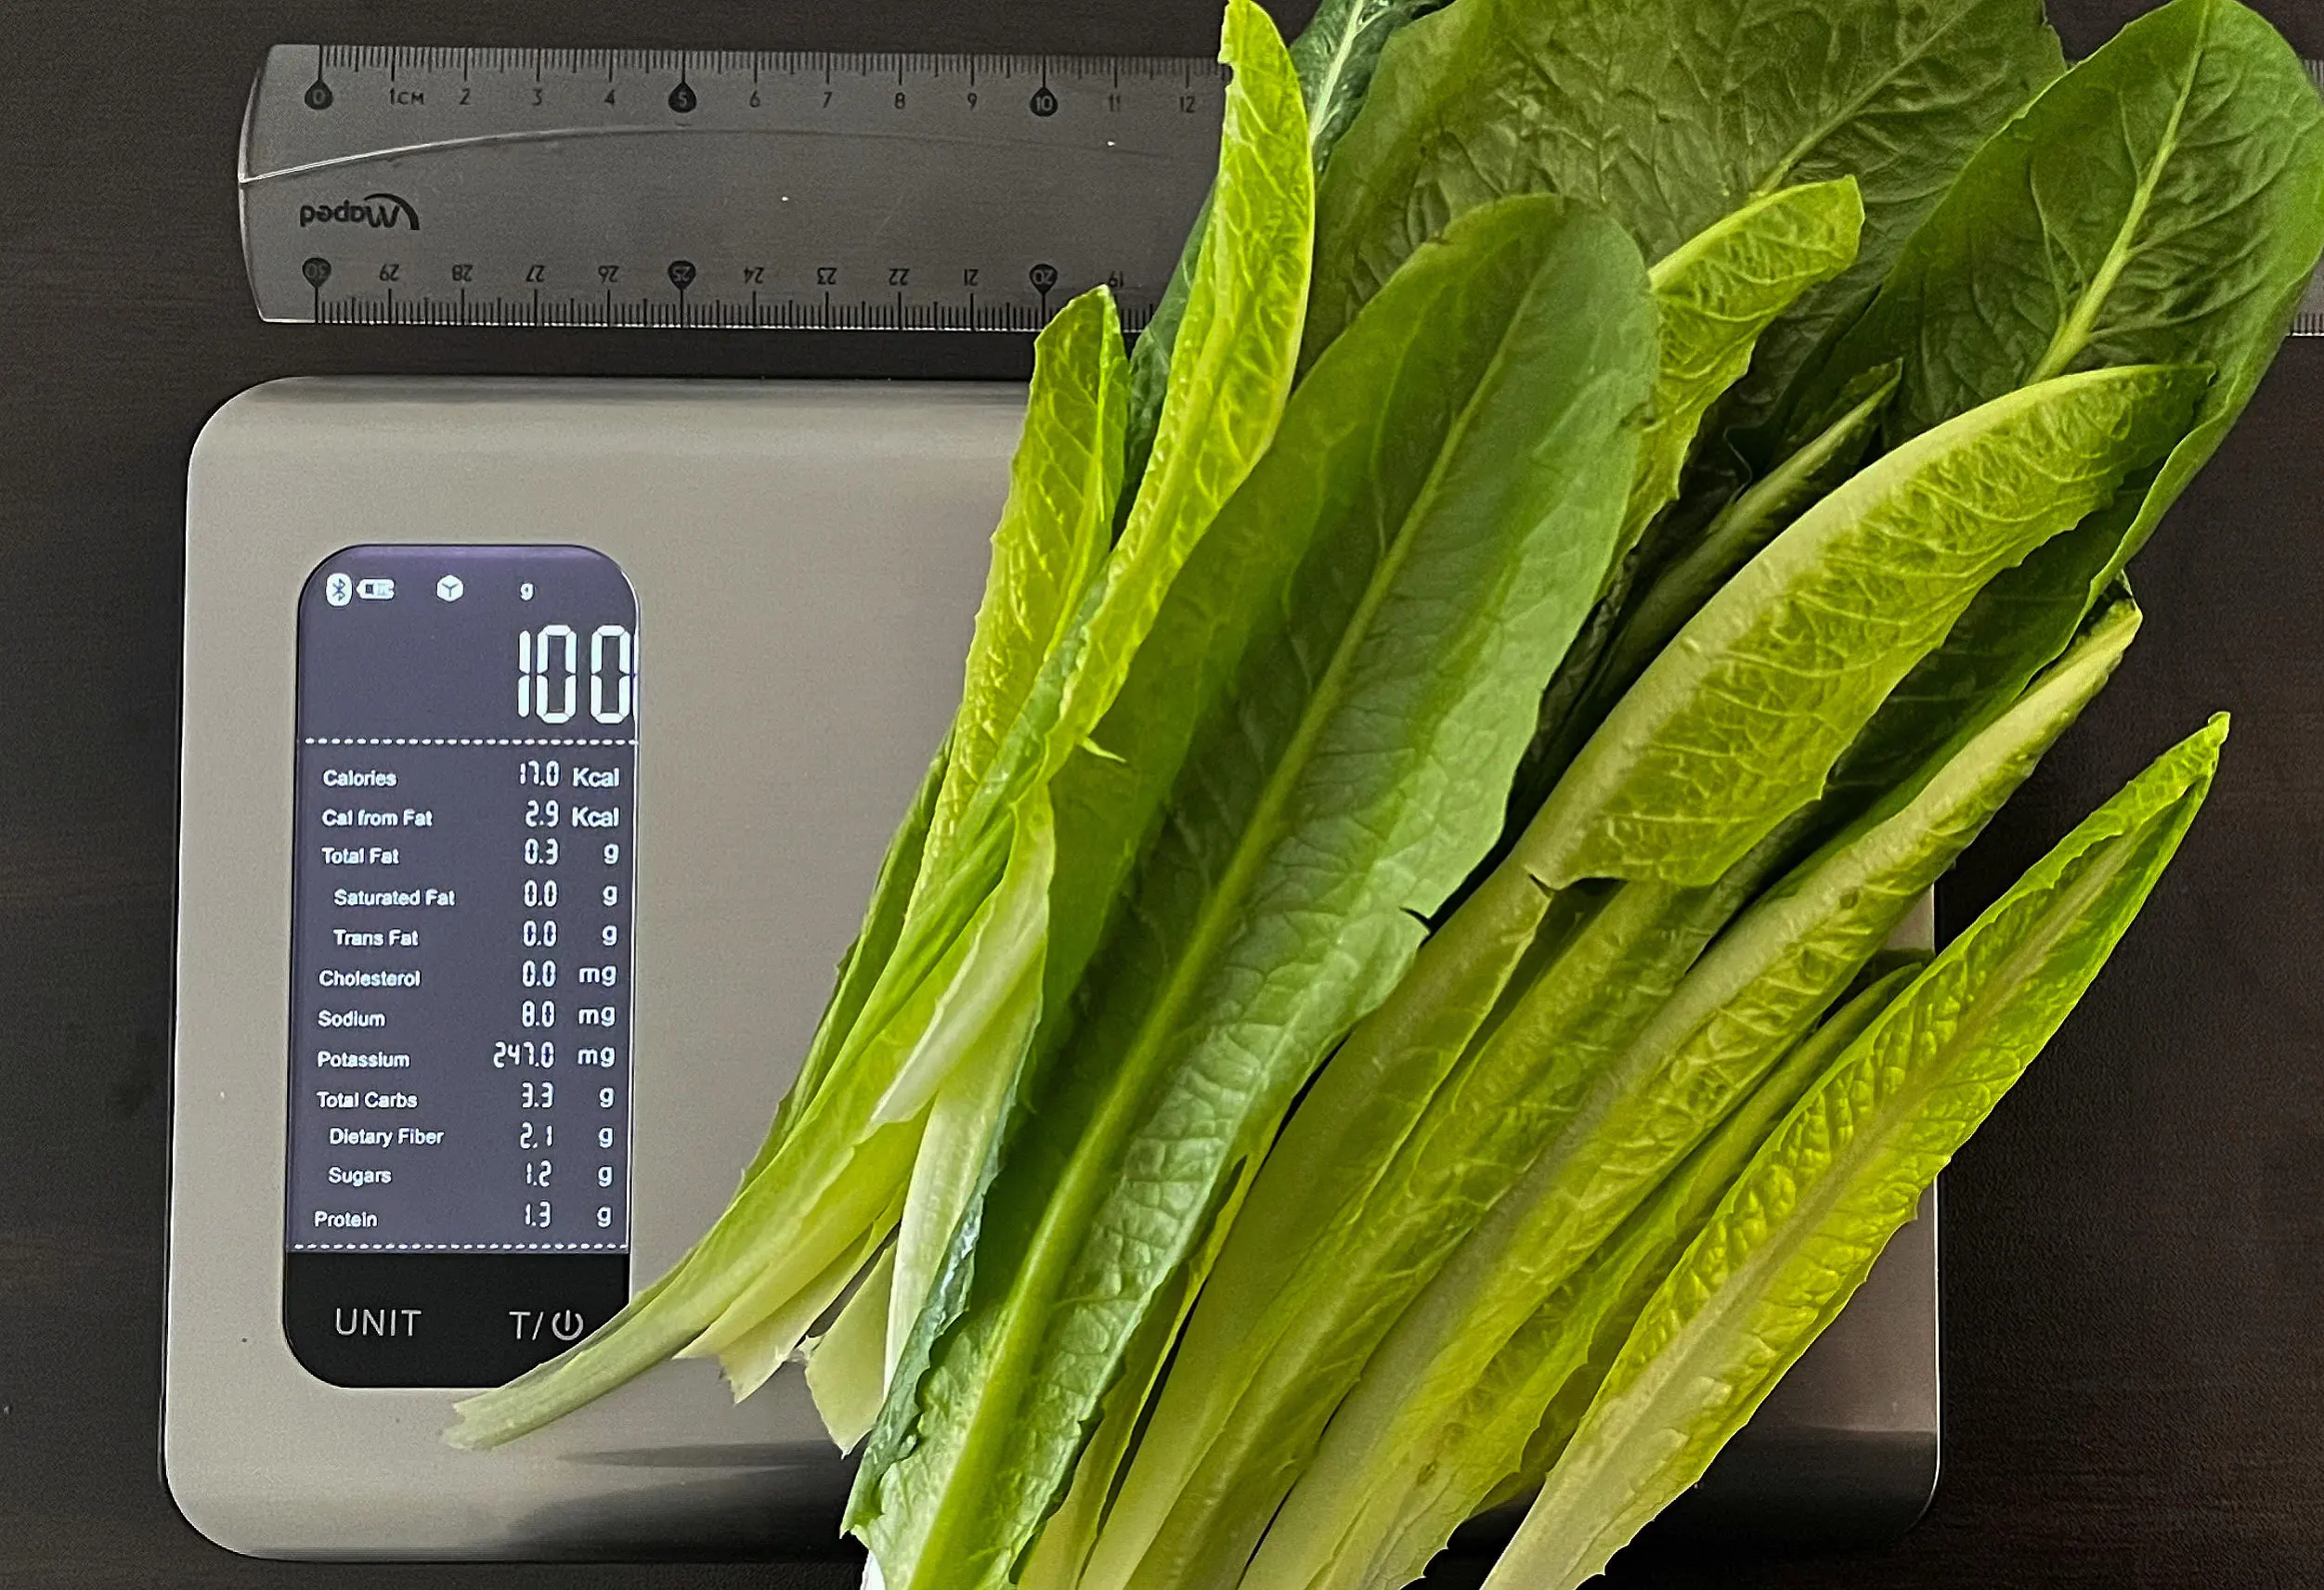
What Do 15 Calories or 100 Grams of Lettuce Look Like?
Our team conducted measurements to visually represent the weight and calorie content of 100 grams of lettuce.
The image below illustrates that approximately 20 lettuce leaves are 100 grams, equivalent to 15-17 calories. This implies that each lettuce leaf weighs approximately 5 grams and contains only 0.75-1 calories.
For practical serving sizes, one cup of lettuce weighs about 36 grams, providing a calorie content of 5.4 calories accordingly. It's important to note that these values may vary based on the specific type and density of the lettuce.
Carbohydrates
Per 100-gram serving, lettuce contains 2.87 grams of carbs. About half of these carbs are net carbs – 1.57g. The rest are fiber (1.3g) and other sugars (glucose, fructose).
Carbohydrate type breakdown
Protein
Lettuce contains small amounts of protein and various essential amino acids, including isoleucine and threonine. Per 100-gram serving of lettuce, you receive about 1.36 grams of protein.
Protein quality breakdown
Fats
Lettuce also contains very small amounts of fat. A 100-gram serving contains only 0.15 grams of fat, which are primarily polyunsaturated fatty acids.
Lettuce contains no cholesterol.
Fat type information
Vitamins
Lettuce is especially rich in Vitamin A and Vitamin K.
Per 100-gram serving, lettuce contains 7405IU of Vitamin A. The recommended daily amount for Vitamin A is around 2000-3000 IU; hence, a 100-gram serving of lettuce fully covers your daily needs.
Lettuce also contains 126.3µg of Vitamin K per 100-gram serving. The daily need for Vitamin K is about 75-120µg; hence, a 100-gram serving of lettuce fully covers the daily need for Vitamin K as well.
Lettuce also contains small amounts of Vitamin C, Vitamin B9 (folate), and Vitamin B6.
It completely lacks Vitamin D and Vitamin B12.
Vitamin coverage chart
Minerals
The predominant minerals found in lettuce are iron and manganese. Per 100-gram serving, lettuce provides 0.25mg of manganese and 0.86mg of iron. It also provides small amounts of other minerals, including 194mg of potassium, 36mg of calcium, and 29mg of phosphorus.
Mineral coverage chart
Oxalates
Even though leafy green vegetables are high in oxalates, the amount of oxalates in lettuce is about 16mg per 100g, which is considered low.
While oxalates are generally considered safe for most people, they can pose a concern for individuals prone to kidney stones or those with certain medical conditions.
Nitrates
Lettuce contains high amounts of nitrates, known for their beneficial and potentially harmful effects on health. The scientific literature on the topic of nitrates and lettuce is conflicting. For instance, an observational study by Bondonno et al. looked at the link between nitrate-rich vegetable consumption and cardiovascular outcomes, revealing that vegetable nitrate had cardioprotective outcomes (11). However, the study was observational, and no causation was established. Other nutrients in the vegetables may have contributed to the improved outcomes.
On the other hand, Brkic et al. examined the nitrate levels in green leafy vegetables across various locations and seasons in Croatia (12). They found that the nitrate levels in lettuce varied across seasons and locations. The authors discovered that the mean value of nitrates in lettuce sampled in spring was 703.7mg/kg, while in autumn, the mean value was higher – 1264.8mg/kg. Although these levels were found to be quite high, they still did not exceed the daily acceptable intake of nitrate.
In the Canary Islands, the average nitrate levels for lettuce were 573.7mg/kg, while in Slovenia, it was 962mg/kg (13, 14). However, some of the samples in Slovenia exceeded the European Union recommendations.
The European Food Safety Authority (EFSA) has released a comprehensive report addressing the risks and benefits of nitrate-rich vegetable consumption (9). The mean nitrate concentration in the report for lettuce samples was 1324mg/kg. However, the production season, method, and region all influenced the nitrate content. Moreover, they referenced studies that discuss how washing off the vegetable reduces the nitrate content by up to 15%, whereas removing the stem reduces the nitrate content by up to 40%.
Their reports suggest that the advantages of consuming these vegetables are undoubtedly important, while the potential negative effects on health are unlikely to have a substantial impact. Another finding highlighted in the report is that the outer leaves of lettuce contain higher concentrations of nitrates than the inner leaves.
Phytochemicals
Lettuce contains high amounts of various phytochemicals. According to a study by Shi et al., the phytochemicals found in lettuce can be divided into three main categories: phenolic compounds, carotenoids, and chlorophyll (1).
Phenolic Compounds
Phenolic compounds in lettuce include phenolic acids and flavonoids (1). The most common phenolic acids identified in lettuce include caffeic acid and chlorogenic acid, which are known to possess antidiabetic, anti-inflammatory, and antibacterial properties.
Quercetin, isorhamnetin, kaempferol, and anthocyanins are the main flavonoids in lettuce, possessing several medicinal benefits, including anticancer, antioxidant, anti-inflammatory, and antiviral properties.
Carotenoids
Carotenoids found in lettuce include carotenes and xanthophylls (1). Research has also found a link between carotenoids and protective cardiovascular, anti-cancer, and anti-obesity effects. Per 100 grams, lettuce contains 4440μg of β-carotene.
Chlorophyll
The chlorophyll A and chlorophyll B found in lettuce have been associated with antioxidant and anticancer properties (1).
Glycemic Index
The glycemic index is a rating system used for foods containing carbohydrates. The glycemic index of lettuce is equal to 32, which means that lettuce is a low-GI food.
Low-GI foods are more favorable for individuals with diabetes, as they help stabilize blood sugar levels.
Acidity
Food acidity measures food's potential to affect the blood's pH. Lettuce is alkaline and has acidity (based on potential renal acid load (PRAL) value) equal to -3.1.
Nutritional Comparison Among Lettuce Varieties
Wild vs. Commercial Lettuce Varieties
In a recent study examining the differences between wild, commercial, and traditional lettuce varieties, Medina-Lozano et al. revealed that wild and traditional varieties contain 21% and 8% more Vitamin C than commercial varieties (10). However, commercial varieties contained the highest amounts of anthocyanins.
Green Leaf vs. Red Leaf Lettuce Varieties
General Nutritional Differences
Green leaf and red leaf lettuce varieties have similar nutritional profiles and provide similar amounts of minerals and vitamins with only very few distinctions. For example, green leaf lettuce provides slightly more Vitamin C. Per 100-gram serving, green leaf lettuce contains 9.2mg of Vitamin C, while red leaf lettuce contains only 3.7mg.
Refer to our green leaf lettuce vs. red leaf lettuce page for the complete nutritional comparison.
Phytochemicals
As mentioned above, lettuce contains three main phytochemical groups, as Shi et al. described. In addition to listing the phytochemical content of lettuce, the authors also discuss how the content varies among different lettuce varieties.
The authors mention that about phenolic compounds, the content may differ in lettuce varieties depending on various factors such as light exposure, harvest conditions, etc. (1). Nevertheless, red lettuce varieties have been found to have more anthocyanin content and higher total phenolics than the green varieties (2, 3, 4, 5, 6). Moreover, in the study of the differences between wild and commercial lettuce varieties mentioned above, Medina-Lozano et al. also revealed that red lettuce varieties contained more anthocyanins. In contrast, green varieties contained more Vitamin C (10).
About carotenoids, mixed research links the prevalence of β-carotene to the color green observed in lettuce. Some authors have linked green lettuce to higher β-carotene content, while others found similar amounts of the carotenoid in red and green varieties (1, 6, 7, 8).
Lettuce Varieties by Shape
In addition to differences in the amounts of phytochemicals observed based on the color, the shape of the lettuce has also been found to be correlated to the amounts of phytochemicals, especially to the amounts of carotenoids and chlorophylls (1). Shi et al. explain that crisphead lettuce, which contains a closed head shape, produces fewer carotenoids due to reduced exposure to sunlight than other types of lettuce. Additionally, the authors cite various articles where the openness or closeness of the lettuce head, depending on the exposure to sunlight, also influences the production of chlorophyll and other metabolites.
In terms of other nutritional differences, when comparing iceberg lettuce to butterhead and romaine varieties, it is evident that it contains fewer vitamins and minerals. Specifically, iceberg lettuce provides about 7 and 17 times less Vitamin A than butterhead and romaine lettuce, respectively. Moreover, iceberg lettuce provides only 0.41mg of iron per 100-gram serving, compared to 1.24mg in butterhead lettuce and 0.97mg in romaine lettuce. The amount of folate in iceberg lettuce is also around 3 and 5 times lower than in butterhead and romaine lettuce types, respectively. Romaine and butterhead varieties also provide around 4 times more Vitamin K than iceberg lettuce.
Consequently, when comparing romaine lettuce to butterhead lettuce, we can see that romaine lettuce provides more folate and Vitamin A than butterhead lettuce. Refer to our butterhead lettuce vs. iceberg lettuce and romaine lettuce vs. iceberg lettuce articles for more information.
Comparison to Similar Foods
Lettuce is often compared with other vegetables, such as arugula and cabbage.
Compared to cabbage, lettuce is richer in Vitamin A and Vitamin K. Meanwhile, cabbage contains higher amounts of Vitamin C. Cabbage also provides slightly more calories and dietary fiber. You can read our Lettuce vs. Cabbage comparison article to learn more.
When comparing lettuce and arugula, although both are rich in Vitamin A, lettuce contains 3 times more than arugula. On the other hand, arugula provides more folate, as well as more calcium and magnesium. Refer to our Lettuce vs. Arugula article to learn more.
Sources
- https://www.ncbi.nlm.nih.gov/pmc/articles/PMC9219965/
- https://pubmed.ncbi.nlm.nih.gov/26065768/
- https://journals.ashs.org/hortsci/view/journals/hortsci/42/2/article-p232.xml
- https://www.sciencedirect.com/science/article/abs/pii/S0308814609005974
- https://www.sciencedirect.com/science/article/pii/S2405896316315804
- https://www.researchgate.net/publication/311337477_
- https://journals.ashs.org/jashs/view/journals/jashs/130/6/article-p870.xml
- https://onlinelibrary.wiley.com/doi/abs/10.1002/jsfa.1916
- https://efsa.onlinelibrary.wiley.com/doi/epdf/10.2903/j.efsa.2008.68
- https://www.sciencedirect.com/science/article/pii/S0308814621008700
- https://link.springer.com/article/10.1007/s10654-021-00747-3
- https://www.ncbi.nlm.nih.gov/pmc/articles/PMC5412236/
- https://www.sciencedirect.com/science/article/abs/pii/S027869152030702X
- https://www.agronomy.it/index.php/agro/article/view/801/893

Important nutritional characteristics for Lettuce
| Glycemic index ⓘ Gi values are taken from various scientific sources. GI values less than 55 are considered as low. Values above 70 are considered as high. | 32 (low) |
| Calories ⓘ Calories per 100-gram serving | 15 |
| Net Carbs ⓘ Net Carbs = Total Carbohydrates – Fiber – Sugar Alcohols | 1.57 grams |
| Serving Size ⓘ Serving sizes are taken from FDA's Reference Amounts Customarily Consumed (RACCs) | 1 cup shredded (36 grams) |
| Acidity (Based on PRAL) ⓘ PRAL (Potential renal acid load) is calculated using a formula. On the PRAL scale the higher the positive value, the more is the acidifying effect on the body. The lower the negative value, the higher the alkalinity of the food. 0 is neutral. | -3.1 (alkaline) |
| Oxalates ⓘ https://www.sciencedirect.com/science/article/abs/pii/S0889157513000902 | 16mg |
Lettuce calories (kcal)
| Serving Size | Calories | Weight |
|---|---|---|
| Calories in 100 grams | 15 | |
| Calories in 1 cup shredded | 5 | 36 g |
| Calories in 1 head | 54 | 360 g |
| Calories in 1 leaf inner | 1 | 4.8 g |
| Calories in 1 leaf outer | 4 | 24 g |
Lettuce Glycemic index (GI)
Mineral chart - relative view
Vitamin chart - relative view
Fiber content ratio for Lettuce
All nutrients for Lettuce per 100g
| Nutrient | Value | DV% | In TOP % of foods | Comparison |
| Calories | 15kcal | 1% | 98% |
3.1 times less than Orange
|
| Protein | 1.36g | 3% | 82% |
2.1 times less than Broccoli
|
| Fats | 0.15g | 0% | 90% |
222.1 times less than Cheddar Cheese
|
| Vitamin C | 9.2mg | 10% | 25% |
5.8 times less than Lemon
|
| Net carbs | 1.57g | N/A | 67% |
34.5 times less than Chocolate
|
| Carbs | 2.87g | 1% | 66% |
9.8 times less than Rice
|
| Cholesterol | 0mg | 0% | 100% |
N/A
|
| Vitamin D | 0µg | 0% | 100% |
N/A
|
| Iron | 0.86mg | 11% | 65% |
3 times less than Beef broiled
|
| Calcium | 36mg | 4% | 40% |
3.5 times less than Milk
|
| Potassium | 194mg | 6% | 60% |
1.3 times more than Cucumber
|
| Magnesium | 13mg | 3% | 77% |
10.8 times less than Almond
|
| Sugar | 0.78g | N/A | 68% |
11.5 times less than Coca-Cola
|
| Fiber | 1.3g | 5% | 46% |
1.8 times less than Orange
|
| Copper | 0.03mg | 3% | 89% |
4.9 times less than Shiitake
|
| Zinc | 0.18mg | 2% | 86% |
35.1 times less than Beef broiled
|
| Starch | 0g | 0% | 100% |
N/A
|
| Phosphorus | 29mg | 4% | 84% |
6.3 times less than Chicken meat
|
| Sodium | 28mg | 1% | 79% |
17.5 times less than White Bread
|
| Vitamin A | 7405IU | 148% | 10% |
2.3 times less than Carrot
|
| Vitamin A RAE | 370µg | 41% | 23% | |
| Vitamin E | 0.22mg | 1% | 74% |
6.6 times less than Kiwifruit
|
| Selenium | 0.6µg | 1% | 88% | |
| Manganese | 0.25mg | 11% | 48% | |
| Vitamin B1 | 0.07mg | 6% | 62% |
3.8 times less than Pea raw
|
| Vitamin B2 | 0.08mg | 6% | 73% |
1.6 times less than Avocado
|
| Vitamin B3 | 0.38mg | 2% | 82% |
25.5 times less than Turkey meat
|
| Vitamin B5 | 0.13mg | 3% | 86% |
8.4 times less than Sunflower seed
|
| Vitamin B6 | 0.09mg | 7% | 67% |
1.3 times less than Oat
|
| Vitamin B12 | 0µg | 0% | 100% |
N/A
|
| Vitamin K | 126.3µg | 105% | 42% |
1.2 times more than Broccoli
|
| Folate | 38µg | 10% | 38% |
1.6 times less than Brussels sprout
|
| Trans Fat | 0g | N/A | 100% |
N/A
|
| Saturated Fat | 0.02g | 0% | 91% |
294.8 times less than Beef broiled
|
| Monounsaturated Fat | 0.01g | N/A | 94% |
1633.2 times less than Avocado
|
| Polyunsaturated fat | 0.08g | N/A | 87% |
575.3 times less than Walnut
|
| Tryptophan | 0.01mg | 0% | 96% |
33.9 times less than Chicken meat
|
| Threonine | 0.06mg | 0% | 93% |
12.2 times less than Beef broiled
|
| Isoleucine | 0.08mg | 0% | 91% |
10.9 times less than Salmon raw
|
| Leucine | 0.08mg | 0% | 94% |
30.8 times less than Tuna Bluefin
|
| Lysine | 0.08mg | 0% | 92% |
5.4 times less than Tofu
|
| Methionine | 0.02mg | 0% | 94% |
6 times less than Quinoa
|
| Phenylalanine | 0.06mg | 0% | 93% |
12.1 times less than Egg
|
| Valine | 0.07mg | 0% | 93% |
29 times less than Soybean raw
|
| Histidine | 0.02mg | 0% | 95% |
34 times less than Turkey meat
|
| Fructose | 0.43g | 1% | 89% |
13.7 times less than Apple
|
| Omega-3 - EPA | 0g | N/A | 100% |
N/A
|
| Omega-3 - DHA | 0g | N/A | 100% |
N/A
|
| Omega-3 - DPA | 0g | N/A | 100% |
N/A
|
Check out similar food or compare with current
NUTRITION FACTS LABEL
Serving Size ______________
Health checks
Lettuce nutrition infographic
References
All the values for which the sources are not specified explicitly are taken from FDA’s Food Central. The exact link to the food presented on this page can be found below.