Համեմատել Iced tea և Ginger ale սննդամթերքների վիտամինները և միներալները
Համեմատել
Infographic
Infographic link
Mineral Comparison
Mineral comparison score is based on the number of minerals by which one or the other food is richer. The "coverage" charts below show how much of the daily needs can be covered by 300 grams of the food.
Պարունակում է
ավելի շատ
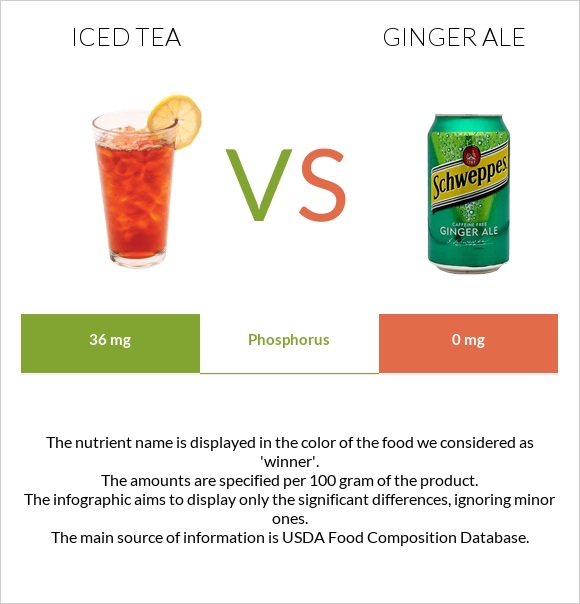
Ֆոսֆոր
+∞%
Պարունակում է
ավելի շատ
Կալիում
+1800%
Պարունակում է
ավելի շատ
Ցինկ
+20%
Պարունակում է
ավելի շատ
Մանգան
+907.7%
Պարունակում է
ավելի շատ
Երկաթ
+∞%
Պարունակում է
ավելի քիչ
Նատրիում
-66.7%
Պարունակում է
ավելի շատ
Պղինձ
+125%
հավասար Կալցիում - 3
հավասար Մագնեզիում - 1
Պարունակում է
ավելի շատ
Ֆոսֆոր
+∞%
Պարունակում է
ավելի շատ
Կալիում
+1800%
Պարունակում է
ավելի շատ
Ցինկ
+20%
Պարունակում է
ավելի շատ
Մանգան
+907.7%
Պարունակում է
ավելի շատ
Երկաթ
+∞%
Պարունակում է
ավելի քիչ
Նատրիում
-66.7%
Պարունակում է
ավելի շատ
Պղինձ
+125%
հավասար Կալցիում - 3
հավասար Մագնեզիում - 1
Vitamin Comparison
Vitamin comparison score is based on the number of vitamins by which one or the other food is richer. The "coverage" charts below show how much of the daily needs can be covered by 300 grams of the food.
:
Macronutrient Comparison
Macronutrient breakdown side-by-side comparison
հավասար Ածխաջրեր - 8.76
հավասար Ջուր - 91.23
հավասար Այլ - 0.01
Սպիտակուցներ:
0 գ
Ճարպեր:
0 գ
Ածխաջրեր:
9.09 գ
Ջուր:
91.18 գ
Այլ:
0 գ
Սպիտակուցներ:
0 գ
Ճարպեր:
0 գ
Ածխաջրեր:
8.76 գ
Ջուր:
91.23 գ
Այլ:
0.01 գ
հավասար Ածխաջրեր - 8.76
հավասար Ջուր - 91.23
հավասար Այլ - 0.01
Comparison summary table
Pay attention at the most right column. It shows the amounts side by side, making it easier to realize the amount of difference.
 |
 |
||
| Lower in Խոլեստերին |
|
||
| Lower in Հագեցած ճարպ |
|
||
| Lower in price |
|
||
| Lower in Շաքար |
|
||
| Lower in Նատրիում |
|
||
| Lower in Գլիկեմիկ ինդեքս |
|
||
| Rich in vitamins |
|
||
| Rich in minerals | Equal | ||
All nutrients comparison - raw data values
| Nutrient | |
|
Opinion |
| Զուտ ածխաջրեր | 9.09g | 8.76g |
|
| Ածխաջրեր | 9.09g | 8.76g |
|
| Կալորիականություն | 36kcal | 34kcal |
|
| Ֆրուկտոզա | 3.7g |
|
|
| Շաքար | 9.09g | 8.9g |
|
| Կալցիում | 3mg | 3mg | |
| Երկաթ | 0mg | 0.18mg |
|
| Մագնեզիում | 1mg | 1mg | |
| Ֆոսֆոր | 36mg | 0mg |
|
| Կալիում | 19mg | 1mg |
|
| Նատրիում | 21mg | 7mg |
|
| Ցինկ | 0.06mg | 0.05mg |
|
| Պղինձ | 0.008mg | 0.018mg |
|
| Մանգան | 0.131mg | 0.013mg |
|
| Սելեն | 0.1µg |
|
Which food is preferable in case of diets?
is better in case of low diet
|
|
|
| Low Ճարպեր diet | Equal | |
| Low Ածխաջրեր diet |
|
|
| Low Կալորիականություն diet |
|
|
| Low glycemic index diet |
|
|
People also compare


Vitamin and Mineral Summary Scores
Summary score is calculated by summing up the daily values contained in 300 grams of the product. Obviously the more the food fulfils human daily needs, the more the summary score is
Vitamin Summary Score
0%
0%
Mineral Summary Score
4%
2%
Comparison summary
Which food is lower in Խոլեստերին?
Iced tea is lower in Խոլեստերին (difference - 0mg)
Which food is lower in Հագեցած ճարպ?
Iced tea is lower in Հագեցած ճարպ (difference - 0g)
Which food is cheaper?
Iced tea is cheaper (difference - $0.6)
Which food is lower in Շաքար?
Ginger ale is lower in Շաքար (difference - 0.19g)
Which food is lower in Նատրիում?
Ginger ale is lower in Նատրիում (difference - 14mg)
Which food is lower in glycemic index?
Ginger ale is lower in glycemic index (difference - 9)
Which food is richer in vitamins?
Ginger ale is relatively richer in vitamins
Which food is richer in minerals?
?
It cannot be definitely stated which food is richer in minerals. See charts below for detailed information.