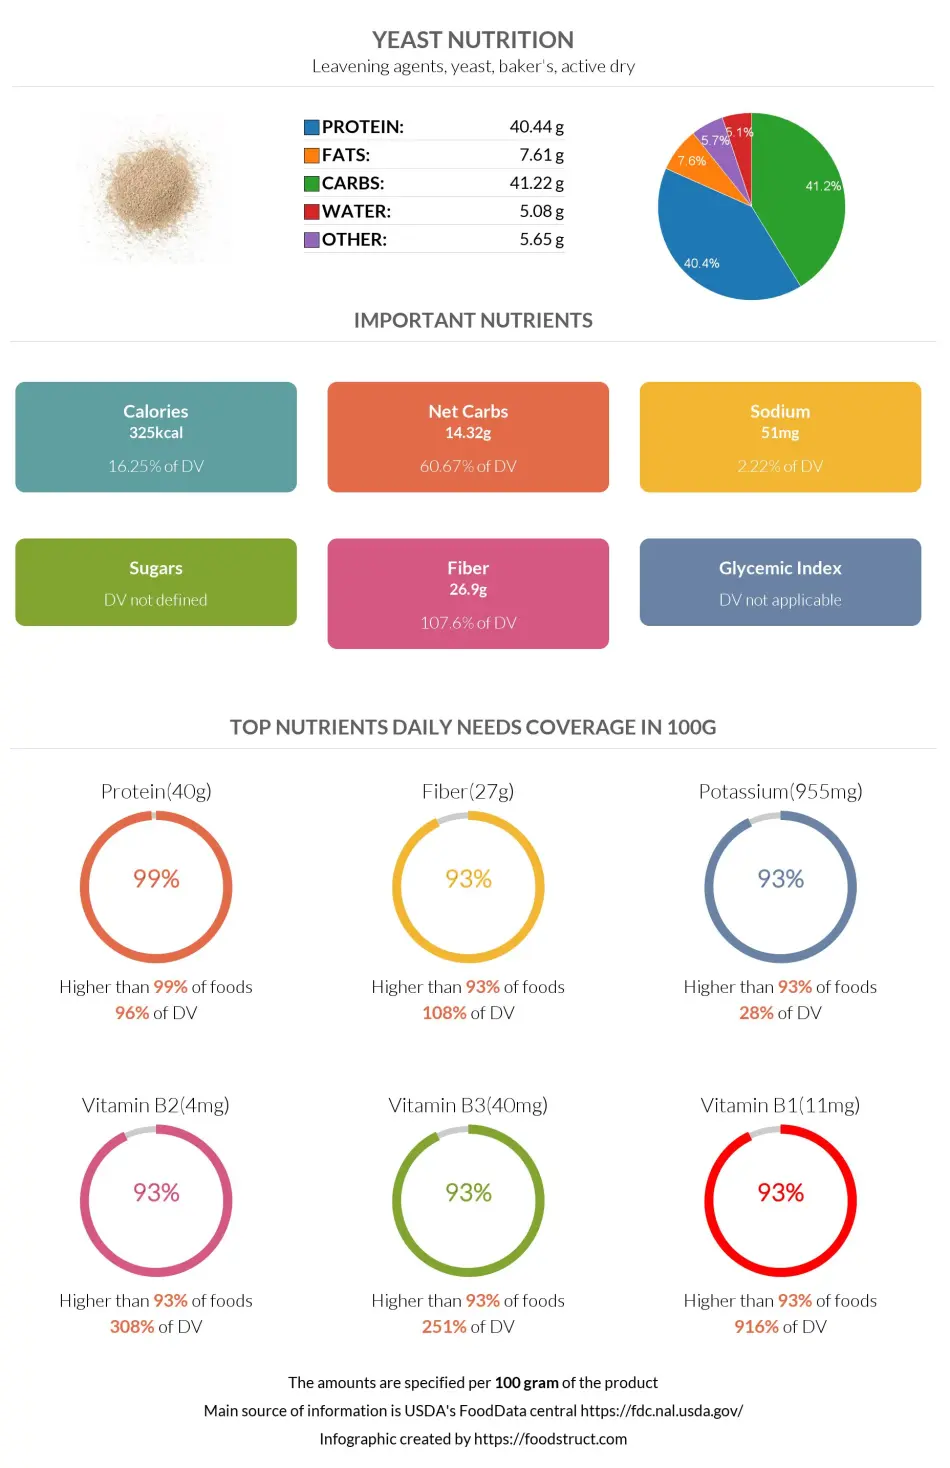
Yeast nutrition: calories, carbs, GI, protein, fiber, fats
Leavening agents, yeast, baker's, active dry
*all the values are displayed for the amount of 100 grams
Important nutritional characteristics for Yeast
| Calories ⓘ Calories for selected serving | 325 kcal |
| Net Carbs ⓘ Net Carbs = Total Carbohydrates – Fiber – Sugar Alcohols | 14 grams |
| Default serving size ⓘ Serving sizes are mostly taken from FDA's Reference Amounts Customarily Consumed (RACCs) | 1 tsp (4 grams) |
| Acidity (Based on PRAL) ⓘ PRAL (Potential renal acid load) is calculated using a formula. On the PRAL scale the higher the positive value, the more is the acidifying effect on the body. The lower the negative value, the higher the alkalinity of the food. 0 is neutral. | 21.5 (acidic) |
Protein ⓘHigher in Protein content than 99% of foods
Fiber ⓘHigher in Fiber content than 93% of foods
Potassium ⓘHigher in Potassium content than 93% of foods
Vitamin B2 ⓘHigher in Vitamin B2 content than 93% of foods
Vitamin B3 ⓘHigher in Vitamin B3 content than 93% of foods
Yeast calories (kcal)
| Serving Size | Calories | Weight |
|---|---|---|
| Calories in 100 grams | 325 | |
| Calories in 1 tsp | 13 | 4 g |
| Calories in 1 tbsp | 39 | 12 g |
| Calories in 1 packet | 23 | 7.2 g |
Mineral coverage chart
Mineral chart - relative view
Vitamin coverage chart
Vitamin A:
0IU of 5,000IU
0%
Vitamin E:
0mg of 15mg
0%
Vitamin D:
0µg of 10µg
0%
Vitamin C:
0.9mg of 90mg
1%
Vitamin B1:
33mg of 1mg
2748%
Vitamin B2:
12mg of 1mg
923%
Vitamin B3:
121mg of 16mg
754%
Vitamin B5:
41mg of 5mg
810%
Vitamin B6:
4.5mg of 1mg
346%
Folate:
7020µg of 400µg
1755%
Vitamin B12:
0.21µg of 2µg
8.8%
Choline:
96mg of 550mg
17%
Vitamin K:
1.2µg of 120µg
1%
Vitamin chart - relative view
Vitamin D
0 µg
TOP 100%
Macronutrients chart
Protein:
Daily Value: 81%
40.4 g of 50 g
40.4 g (81% of DV )
Fats:
Daily Value: 12%
7.6 g of 65 g
7.6 g (12% of DV )
Carbs:
Daily Value: 14%
41.2 g of 300 g
41.2 g (14% of DV )
Water:
Daily Value: 0%
5.1 g of 2,000 g
5.1 g (0% of DV )
Other:
5.7 g
5.7 g
Protein quality breakdown
Tryptophan:
1620mg of 280mg
579%
Threonine:
5970mg of 1,050mg
569%
Isoleucine:
5670mg of 1,400mg
405%
Leucine:
8760mg of 2,730mg
321%
Lysine:
9840mg of 2,100mg
469%
Methionine:
1770mg of 1,050mg
169%
Phenylalanine:
5250mg of 1,750mg
300%
Valine:
6930mg of 1,820mg
381%
Histidine:
2730mg of 700mg
390%
Fat type information
Saturated Fat:
1 g
Monounsaturated Fat:
4.3 g
Polyunsaturated fat:
0.02 g
Fiber content ratio for Yeast
Sugar:
0 g
Fiber:
27 g
Other:
14 g
All nutrients for Yeast per 100g
| Nutrient | Value | DV% | In TOP % of foods | Comparison |
| Calories | 325kcal | 16% | 27% |
6.9 times more than Orange
|
| Protein | 40g | 96% | 1% |
14.3 times more than Broccoli
|
| Fats | 7.6g | 12% | 41% |
4.4 times less than Cheese
|
| Vitamin C | 0.3mg | 0% | 50% |
176.7 times less than Lemon
|
| Net carbs | 14g | N/A | 39% |
3.8 times less than Chocolate
|
| Carbs | 41g | 14% | 24% |
1.5 times more than Rice
|
| Cholesterol | 0mg | 0% | 100% |
N/A
|
| Vitamin D | 0µg | 0% | 100% |
N/A
|
| Magnesium | 54mg | 13% | 21% |
2.6 times less than Almonds
|
| Calcium | 30mg | 3% | 44% |
4.2 times less than Milk
|
| Potassium | 955mg | 28% | 7% |
6.5 times more than Cucumber
|
| Iron | 2.2mg | 27% | 34% |
1.2 times less than Beef broiled
|
| Sugar | 0g | N/A | 100% |
N/A
|
| Fiber | 27g | 108% | 7% |
11.2 times more than Orange
|
| Copper | 0.44mg | 48% | 21% |
3.1 times more than Shiitake
|
| Zinc | 7.9mg | 72% | 11% |
1.3 times more than Beef broiled
|
| Phosphorus | 637mg | 91% | 8% |
3.5 times more than Chicken meat
|
| Sodium | 51mg | 2% | 71% |
9.6 times less than White Bread
|
| Vitamin A | 0µg | 0% | 100% | |
| Vitamin E | 0mg | 0% | 100% |
N/A
|
| Selenium | 7.9µg | 14% | 63% | |
| Manganese | 0.31mg | 14% | 44% | |
| Vitamin B1 | 11mg | 916% | 7% |
41.3 times more than Pea raw
|
| Vitamin B2 | 4mg | 308% | 7% |
30.8 times more than Avocado
|
| Vitamin B3 | 40mg | 251% | 7% |
4.2 times more than Turkey meat
|
| Vitamin B5 | 14mg | 270% | 26% |
11.9 times more than Sunflower seeds
|
| Vitamin B6 | 1.5mg | 115% | 13% |
12.6 times more than Oat
|
| Vitamin B12 | 0.07µg | 3% | 64% |
10 times less than Pork
|
| Vitamin K | 0.4µg | 0% | 82% |
254 times less than Broccoli
|
| Folate | 2340µg | 585% | 14% |
38.4 times more than Brussels sprouts
|
| Saturated Fat | 1g | 5% | 60% |
5.9 times less than Beef broiled
|
| Choline | 32mg | 6% | 70% | |
| Monounsaturated Fat | 4.3g | N/A | 35% |
2.3 times less than Avocado
|
| Polyunsaturated fat | 0.02g | N/A | 94% |
2774.9 times less than Walnut
|
| Tryptophan | 0.54mg | 0% | 42% |
1.8 times more than Chicken meat
|
| Threonine | 2mg | 0% | 42% |
2.8 times more than Beef broiled
|
| Isoleucine | 1.9mg | 0% | 42% |
2.1 times more than Salmon raw
|
| Leucine | 2.9mg | 0% | 42% |
1.2 times more than Tuna Bluefin
|
| Lysine | 3.3mg | 0% | 42% |
7.3 times more than Tofu
|
| Methionine | 0.59mg | 0% | 58% |
6.1 times more than Quinoa
|
| Phenylalanine | 1.8mg | 0% | 42% |
2.6 times more than Egg
|
| Valine | 2.3mg | 0% | 42% |
1.1 times more than Soybean raw
|
| Histidine | 0.91mg | 0% | 49% |
1.2 times more than Turkey meat
|
| Omega-3 - EPA | 0g | N/A | 100% |
N/A
|
| Omega-3 - DHA | 0g | N/A | 100% |
N/A
|
| Omega-3 - DPA | 0g | N/A | 100% |
N/A
|
Check out similar food or compare with current
NUTRITION FACTS LABEL
Nutrition Facts
___servings per container
Serving Size ______________
Serving Size ______________
Amount Per 100g
Calories 325
% Daily Value*
12%
Total Fat
7.6g
4.6%
Saturated Fat 1g
0
Trans Fat
0g
0
Cholesterol 0mg
2.2%
Sodium 51mg
14%
Total Carbohydrate
41g
108%
Dietary Fiber
27g
Total Sugars 0g
Includes ? g Added Sugars
Protein
40g
Vitamin D
0mcg
0
Calcium
30mg
3%
Iron
2.2mg
27%
Potassium
955mg
28%
*
The % Daily Value (DV) tells you how much a nutrient in a serving of food contributes to a daily diet. 2,000 calories a day is used for general nutrition advice.
Health checks
ⓘ
Dietary cholesterol is not associated with an increased risk of coronary heart disease in healthy individuals. However, dietary cholesterol is common in foods that are high in harmful saturated fats.
Source
Low in Cholesterol
ⓘ
Trans fat consumption increases the risk of cardiovascular disease and mortality by negatively affecting blood lipid levels.
Source
No Trans Fats
ⓘ
Saturated fat intake can raise total cholesterol and LDL (low-density lipoprotein) levels, leading to an increased risk of atherosclerosis. Dietary guidelines recommend limiting saturated fats to under 10% of calories a day.
Source
Low in Saturated Fats
ⓘ
While the consumption of moderate amounts of added sugars is not detrimental to health, an excessive intake can increase the risk of obesity, and therefore, diabetes.
Source
Low in Sugars
Yeast nutrition infographic
Infographic link
References
All the values for which the sources are not specified explicitly are taken from FDA’s Food Central. The exact link to the food presented on this page can be found below.