Pistachio nutrition: calories, carbs, GI, protein, fiber, fats
Nuts, pistachio nuts, raw
*all the values are displayed for the amount of 100 grams
Medically reviewed by Jack Yacoubian


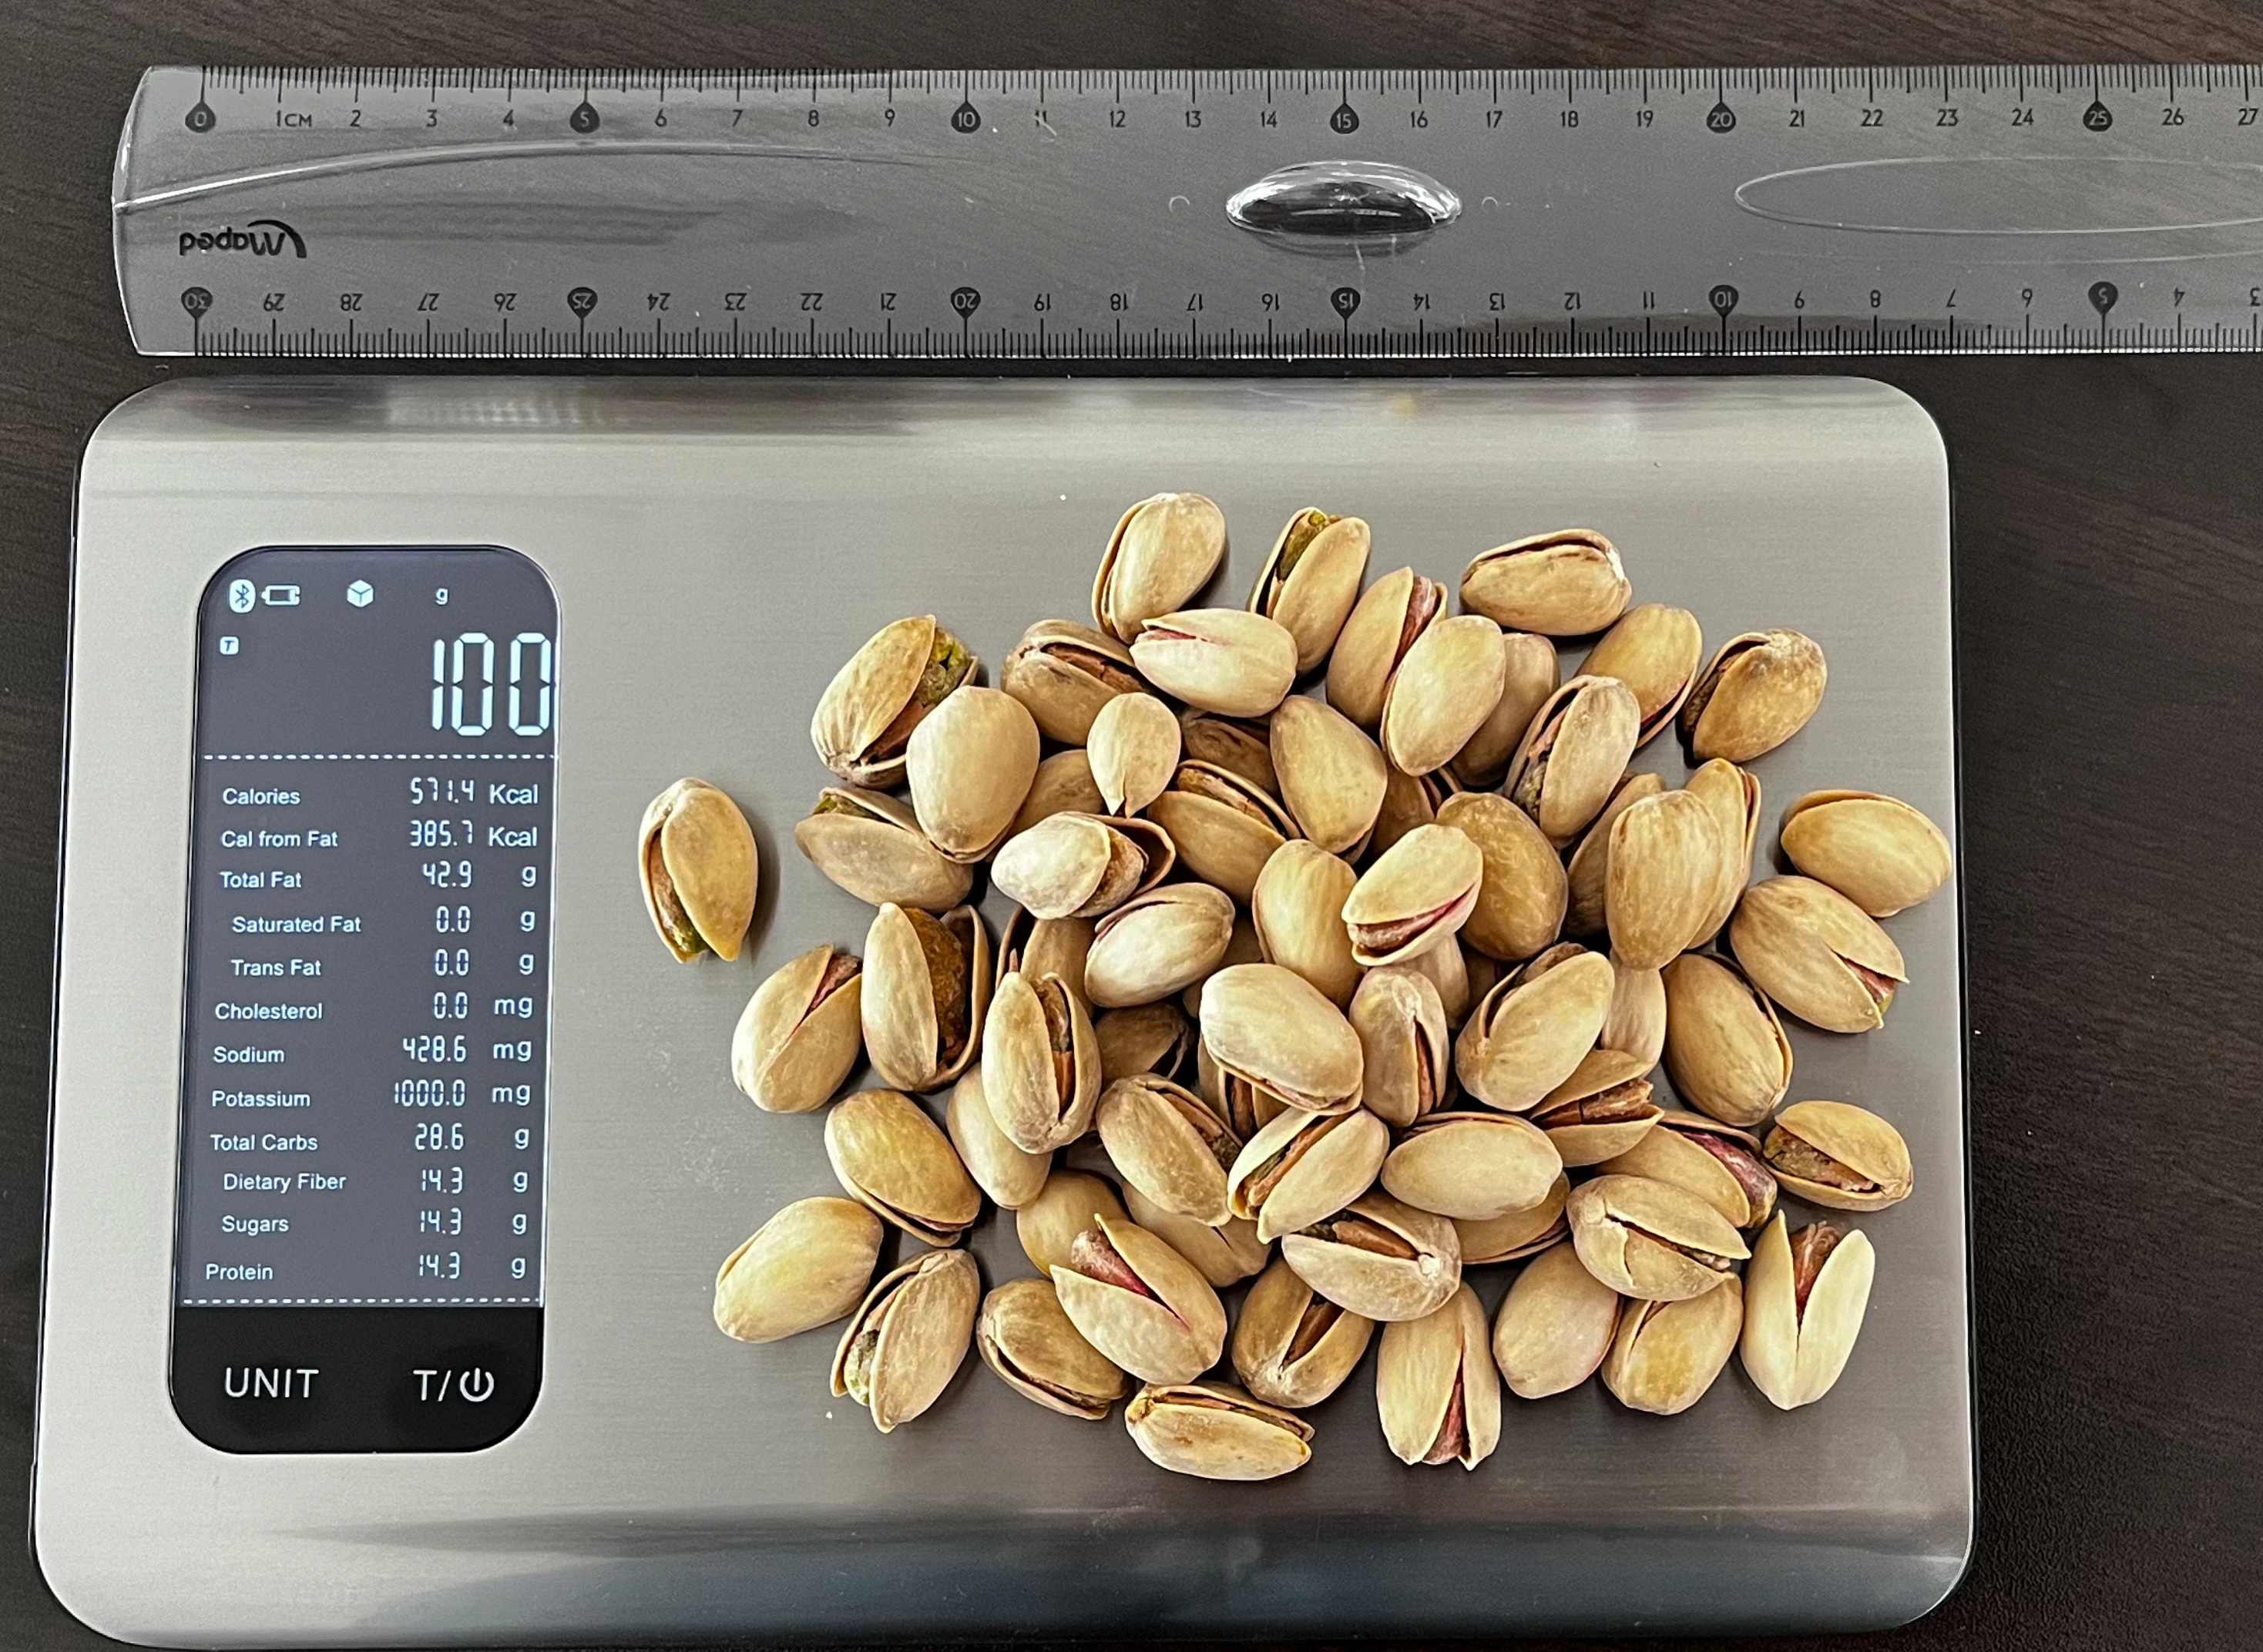
What Do 560 Calories or 100 Grams of Pistachios Look Like?
The picture below shows that 46 pistachios comprise 100 grams or 560-570 calories. Remember that the calorie count can change based on the weight size of the pistachios.
According to our calculations, each pistachio is about 2.2 grams or around 12 calories. One serving of pistachios (28.35g) contains 159 calories accordingly.

Education: General Medicine at YSMU
Last updated: October 31, 2023
Medically reviewed by Jack Yacoubian
Important nutritional characteristics for Pistachio
|
Glycemic index ⓘ
Source: Check out our full article on Pistachio glycemic index https://www.ijmrhs.com/medical-research/dry-fruits-and-diabetes-mellitus.pdfCheck out our Glycemic index chart page for the full list.
|
28 (low) |
| Glycemic load | 1 (low) |
| Calories ⓘ Calories per 100-gram serving | 560 |
| Net Carbs ⓘ Net Carbs = Total Carbohydrates – Fiber – Sugar Alcohols | 16.57 grams |
| Serving Size ⓘ Serving sizes are taken from FDA's Reference Amounts Customarily Consumed (RACCs) | 1 oz (49 kernels) (28.35 grams) |
| Acidity (Based on PRAL) ⓘ PRAL (Potential renal acid load) is calculated using a formula. On the PRAL scale the higher the positive value, the more is the acidifying effect on the body. The lower the negative value, the higher the alkalinity of the food. 0 is neutral. | 2 (acidic) |
| Oxalates ⓘ https://www.sciencedirect.com/science/article/abs/pii/S0889157513000902 | 67mg |
Calories ⓘHigher in Calories content than 97% of foods
Fats ⓘHigher in Fats content than 96% of foods
Potassium ⓘHigher in Potassium content than 93% of foods
Polyunsaturated fat ⓘHigher in Polyunsaturated fat content than 90% of foods
Monounsaturated Fat ⓘHigher in Monounsaturated Fat content than 90% of foods
Pistachio calories (kcal)
| Serving Size | Calories | Weight |
|---|---|---|
| Calories in 100 grams | 560 | |
| Calories in 1 cup | 689 | 123 g |
| Calories in 1 kernel | 4 | 0.7 g |
Pistachio Glycemic index (GI)
Source:
Check out our full article on Pistachio glycemic index
https://www.ijmrhs.com/medical-research/dry-fruits-and-diabetes-mellitus.pdfCheck out our Glycemic index chart page for the full list.
Pistachio Glycemic load (GL)
Mineral coverage chart
Calcium:
105 mg of 1,000 mg
11%
Iron:
3.92 mg of 8 mg
49%
Magnesium:
121 mg of 420 mg
29%
Phosphorus:
490 mg of 700 mg
70%
Potassium:
1025 mg of 3,400 mg
30%
Sodium:
1 mg of 2,300 mg
0%
Zinc:
2.2 mg of 11 mg
20%
Copper:
1.3 mg of 1 mg
144%
Manganese:
1.2 mg of 2 mg
52%
Selenium:
7 µg of 55 µg
13%
Choline:
0 mg of 550 mg
0%
Mineral chart - relative view
Potassium
1025 mg
TOP 7%
Phosphorus
490 mg
TOP 10%
Magnesium
121 mg
TOP 13%
Iron
3.92 mg
TOP 14%
Copper
1.3 mg
TOP 16%
Calcium
105 mg
TOP 21%
Manganese
1.2 mg
TOP 31%
Zinc
2.2 mg
TOP 37%
Selenium
7 µg
TOP 64%
Sodium
1 mg
TOP 98%
Vitamin coverage chart
Vitamin A:
516 IU of 5,000 IU
10%
Vitamin E :
2.86 mg of 15 mg
19%
Vitamin D:
0 µg of 10 µg
0%
Vitamin C:
5.6 mg of 90 mg
6%
Vitamin B1:
0.87 mg of 1 mg
73%
Vitamin B2:
0.16 mg of 1 mg
12%
Vitamin B3:
1.3 mg of 16 mg
8%
Vitamin B5:
0.52 mg of 5 mg
10%
Vitamin B6:
1.7 mg of 1 mg
131%
Folate:
51 µg of 400 µg
13%
Vitamin B12:
0 µg of 2 µg
0%
Vitamin K:
0 µg of 120 µg
0%
Vitamin chart - relative view
Vitamin B1
0.87 mg
TOP 11%
Vitamin B6
1.7 mg
TOP 12%
Vitamin A
516 IU
TOP 24%
Vitamin C
5.6 mg
TOP 29%
Folate
51 µg
TOP 34%
Vitamin E
2.86 mg
TOP 38%
Vitamin B2
0.16 mg
TOP 56%
Vitamin B5
0.52 mg
TOP 57%
Vitamin B3
1.3 mg
TOP 65%
Vitamin D
0 µg
TOP 100%
Vitamin B12
0 µg
TOP 100%
Macronutrients chart
Protein:
Daily Value: 40%
20.16 g of 50 g
40%
Fats:
Daily Value: 70%
45.32 g of 65 g
70%
Carbs:
Daily Value: 9%
27.17 g of 300 g
9%
Water:
Daily Value: 0%
4.37 g of 2,000 g
0%
Other:
2.98 g
Protein quality breakdown
Tryptophan:
251 mg of 280 mg
90%
Threonine:
684 mg of 1,050 mg
65%
Isoleucine:
917 mg of 1,400 mg
66%
Leucine:
1604 mg of 2,730 mg
59%
Lysine:
1138 mg of 2,100 mg
54%
Methionine:
360 mg of 1,050 mg
34%
Phenylalanine:
1092 mg of 1,750 mg
62%
Valine:
1249 mg of 1,820 mg
69%
Histidine:
512 mg of 700 mg
73%
Fat type information
Saturated Fat:
5.907 g
Monounsaturated Fat:
23.257 g
Polyunsaturated fat:
14.38 g
Carbohydrate type breakdown
Starch:
1.67 g
Sucrose:
6.87 g
Glucose:
0.32 g
Fructose:
0.24 g
Lactose:
0 g
Maltose:
0.17 g
Galactose:
0 g
Fiber content ratio for Pistachio
Sugar:
7.66 g
Fiber:
10.6 g
Other:
8.91 g
All nutrients for Pistachio per 100g
| Nutrient | Value | DV% | In TOP % of foods | Comparison |
| Calories | 560kcal | 28% | 3% |
11.9 times more than Orange
|
| Protein | 20.16g | 48% | 24% |
7.1 times more than Broccoli
|
| Fats | 45.32g | 70% | 4% |
1.4 times more than Cheddar Cheese
|
| Vitamin C | 5.6mg | 6% | 29% |
9.5 times less than Lemon
|
| Net carbs | 16.57g | N/A | 35% |
3.3 times less than Chocolate
|
| Carbs | 27.17g | 9% | 28% |
Equal to Rice
|
| Cholesterol | 0mg | 0% | 100% |
N/A
|
| Vitamin D | 0µg | 0% | 100% |
N/A
|
| Iron | 3.92mg | 49% | 14% |
1.5 times more than Beef broiled
|
| Calcium | 105mg | 11% | 21% |
1.2 times less than Milk
|
| Potassium | 1025mg | 30% | 7% |
7 times more than Cucumber
|
| Magnesium | 121mg | 29% | 13% |
1.2 times less than Almond
|
| Sugar | 7.66g | N/A | 43% |
1.2 times less than Coca-Cola
|
| Fiber | 10.6g | 42% | 10% |
4.4 times more than Orange
|
| Copper | 1.3mg | 144% | 16% |
9.2 times more than Shiitake
|
| Zinc | 2.2mg | 20% | 37% |
2.9 times less than Beef broiled
|
| Starch | 1.67g | 1% | 96% |
9.2 times less than Potato
|
| Phosphorus | 490mg | 70% | 10% |
2.7 times more than Chicken meat
|
| Sodium | 1mg | 0% | 98% |
490 times less than White Bread
|
| Vitamin A | 516IU | 10% | 24% |
32.4 times less than Carrot
|
| Vitamin A RAE | 26µg | 3% | 41% | |
| Vitamin E | 2.86mg | 19% | 38% |
2 times more than Kiwifruit
|
| Selenium | 7µg | 13% | 64% | |
| Manganese | 1.2mg | 52% | 31% | |
| Vitamin B1 | 0.87mg | 73% | 11% |
3.3 times more than Pea raw
|
| Vitamin B2 | 0.16mg | 12% | 56% |
1.2 times more than Avocado
|
| Vitamin B3 | 1.3mg | 8% | 65% |
7.4 times less than Turkey meat
|
| Vitamin B5 | 0.52mg | 10% | 57% |
2.2 times less than Sunflower seed
|
| Vitamin B6 | 1.7mg | 131% | 12% |
14.3 times more than Oat
|
| Vitamin B12 | 0µg | 0% | 100% |
N/A
|
| Folate | 51µg | 13% | 34% |
1.2 times less than Brussels sprout
|
| Trans Fat | 0g | N/A | 100% |
N/A
|
| Saturated Fat | 5.91g | 30% | 21% |
Equal to Beef broiled
|
| Monounsaturated Fat | 23.26g | N/A | 10% |
2.4 times more than Avocado
|
| Polyunsaturated fat | 14.38g | N/A | 10% |
3.3 times less than Walnut
|
| Tryptophan | 0.25mg | 0% | 57% |
1.2 times less than Chicken meat
|
| Threonine | 0.68mg | 0% | 69% |
1.1 times less than Beef broiled
|
| Isoleucine | 0.92mg | 0% | 63% |
Equal to Salmon raw
|
| Leucine | 1.6mg | 0% | 63% |
1.5 times less than Tuna Bluefin
|
| Lysine | 1.14mg | 0% | 70% |
2.5 times more than Tofu
|
| Methionine | 0.36mg | 0% | 70% |
3.8 times more than Quinoa
|
| Phenylalanine | 1.09mg | 0% | 50% |
1.6 times more than Egg
|
| Valine | 1.25mg | 0% | 54% |
1.6 times less than Soybean raw
|
| Histidine | 0.51mg | 0% | 68% |
1.5 times less than Turkey meat
|
| Fructose | 0.24g | 0% | 90% |
24.6 times less than Apple
|
| Omega-3 - EPA | 0g | N/A | 100% |
N/A
|
| Omega-3 - DHA | 0g | N/A | 100% |
N/A
|
| Omega-3 - DPA | 0g | N/A | 100% |
N/A
|
| Omega-6 - Eicosadienoic acid | 0g | N/A | 100% | |
| Omega-6 - Linoleic acid | 14.09g | N/A | 80% |
1.1 times more than Almond
|
Check out similar food or compare with current
NUTRITION FACTS LABEL
Nutrition Facts
___servings per container
Serving Size ______________
Serving Size ______________
Amount Per 100g
Calories 560
% Daily Value*
69%
Total Fat
45g
27%
Saturated Fat 6g
0%
Cholesterol 0mg
0%
Sodium 1mg
9%
Total Carbohydrate
27g
44%
Dietary Fiber
11g
Total Sugars g
Includes ? g Added Sugars
Protein
20g
Vitamin D
0mcg
0%
Calcium
105mg
11%
Iron
4mg
50%
Potassium
1,025mg
0%
*
The % Daily Value (DV) tells you how much a nutrient in a serving of food contributes to a daily diet. 2,000 calories a day is used for general nutrition advice.
Health checks
Low in Cholesterol
ⓘ
Dietary cholesterol is not associated with an increased risk of coronary heart disease in healthy individuals. However, dietary cholesterol is common in foods that are high in harmful saturated fats.
Source
No Trans Fats
ⓘ
Trans fat consumption increases the risk of cardiovascular disease and mortality by negatively affecting blood lipid levels.
Source
Low in Saturated Fats
ⓘ
Saturated fat intake can raise total cholesterol and LDL (low-density lipoprotein) levels, leading to an increased risk of atherosclerosis. Dietary guidelines recommend limiting saturated fats to under 10% of calories a day.
Source
Low in Sugars
ⓘ
While the consumption of moderate amounts of added sugars is not detrimental to health, an excessive intake can increase the risk of obesity, and therefore, diabetes.
Source
Pistachio nutrition infographic
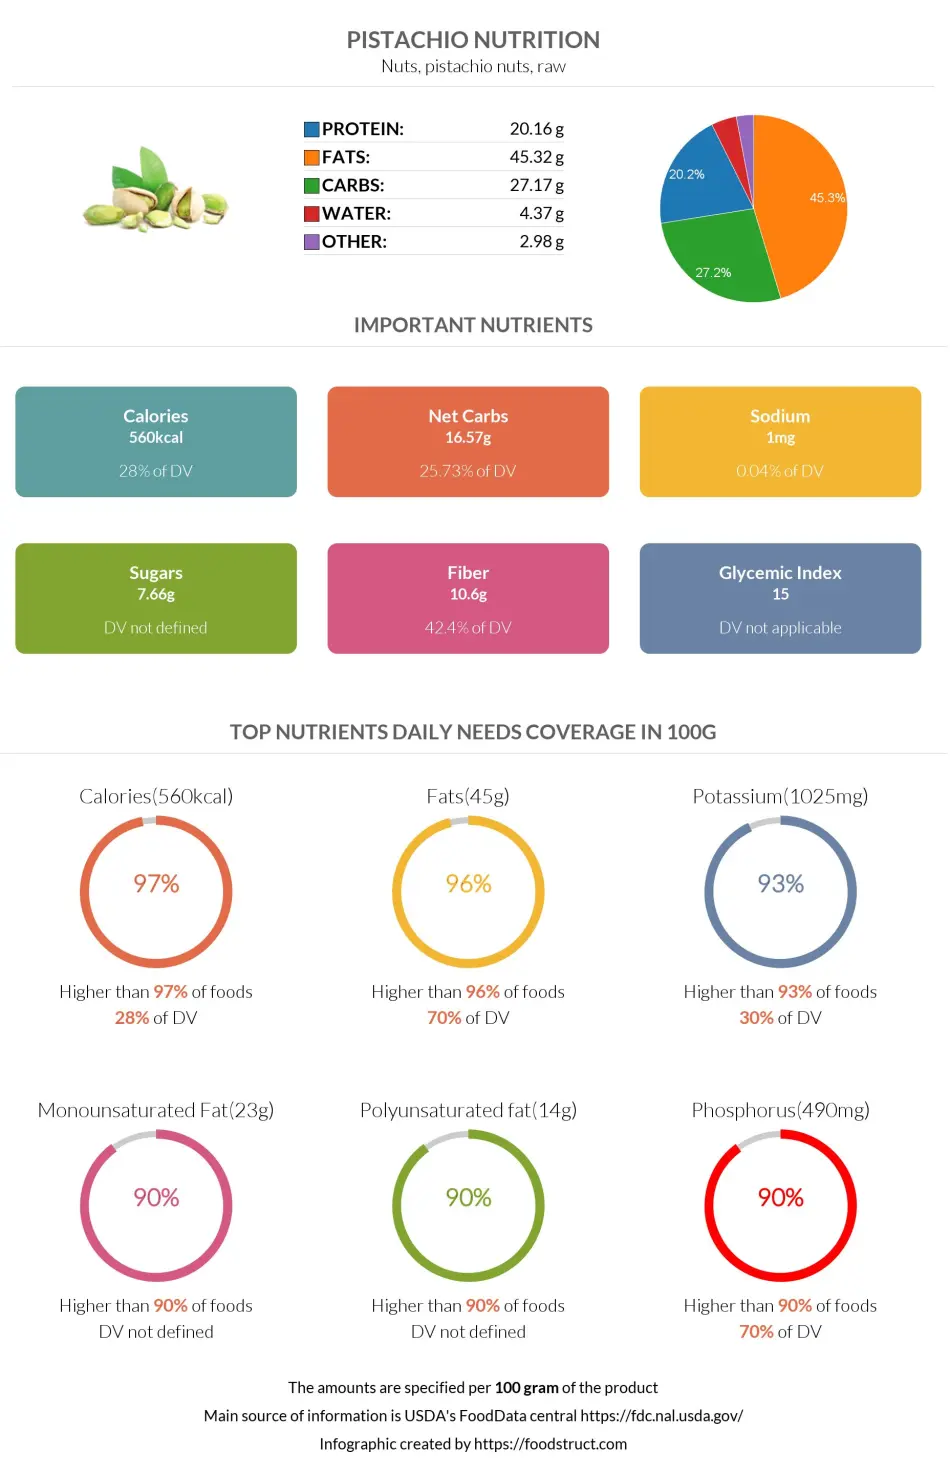
Infographic link
References
All the values for which the sources are not specified explicitly are taken from FDA’s Food Central. The exact link to the food presented on this page can be found below.