Pears nutrition: glycemic index, calories, weight loss and diets

Introduction
Pears are often distinguished by their unique shape and are associated with Fall. This article will discuss a pear’s nutrition, its impact on health, how it fits in different diets, and much more.
Table of contents
Classification
Pears grow on trees or shrubs that belong to the Rosaceae family and the Pyrus genus. Belonging to this family, they are related to apples, peaches, apricots, cherries, strawberries, and many other fruits.
There are estimated to be around 3000 varieties of pears. Most of these varieties are ready to harvest from mid-August to October. Like apples, pears are pome fruits, having a core with tiny seeds, tough flesh, and edible skin.
Nutrition
Fruits have always been associated with being full of vitamins and other health-beneficial nutrients, but what exactly does a pear consist of?
Calories in a Pear
A 100g of pear contains 57 calories. An average serving is a middle-sized pear that weighs around 166g. Therefore, one serving of a pear contains 97 calories.
This number is only slightly higher than an apple's caloric content and is considered low.
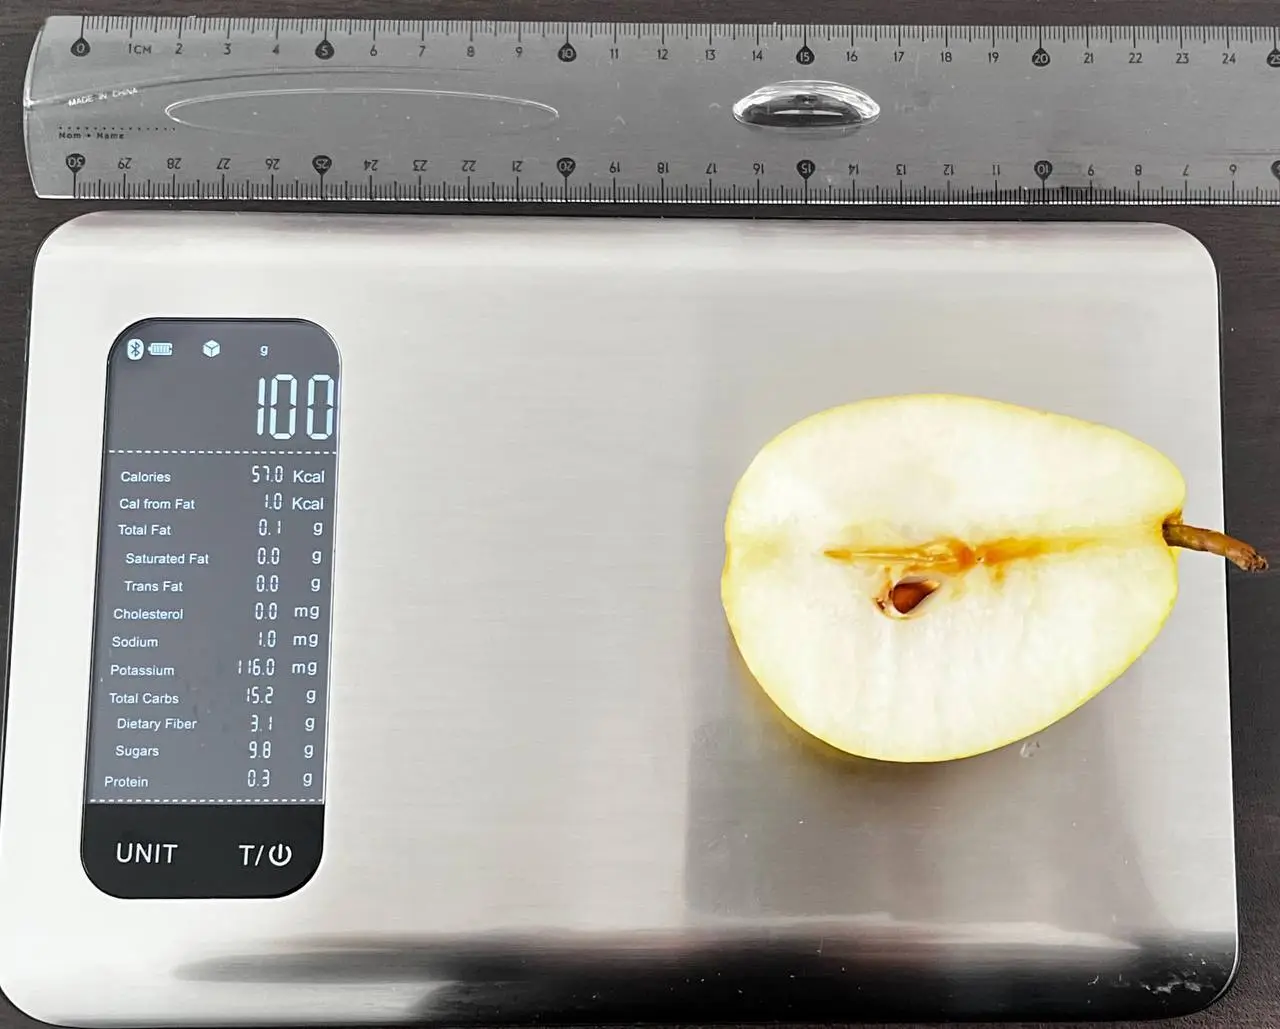
What Does 57 Calories or 100 Grams of Pear Look Like?
We measured what 100 grams of pear looks like to help you visualize its weight and calories. As you can see from the picture below, half of the middle-sized pear comprised 100 grams or 57 calories, meaning that one whole pear is about 200 grams or 114 calories.
Depending on the size and ripeness of the pear, the weight and calories may differ for you.
Macronutrients
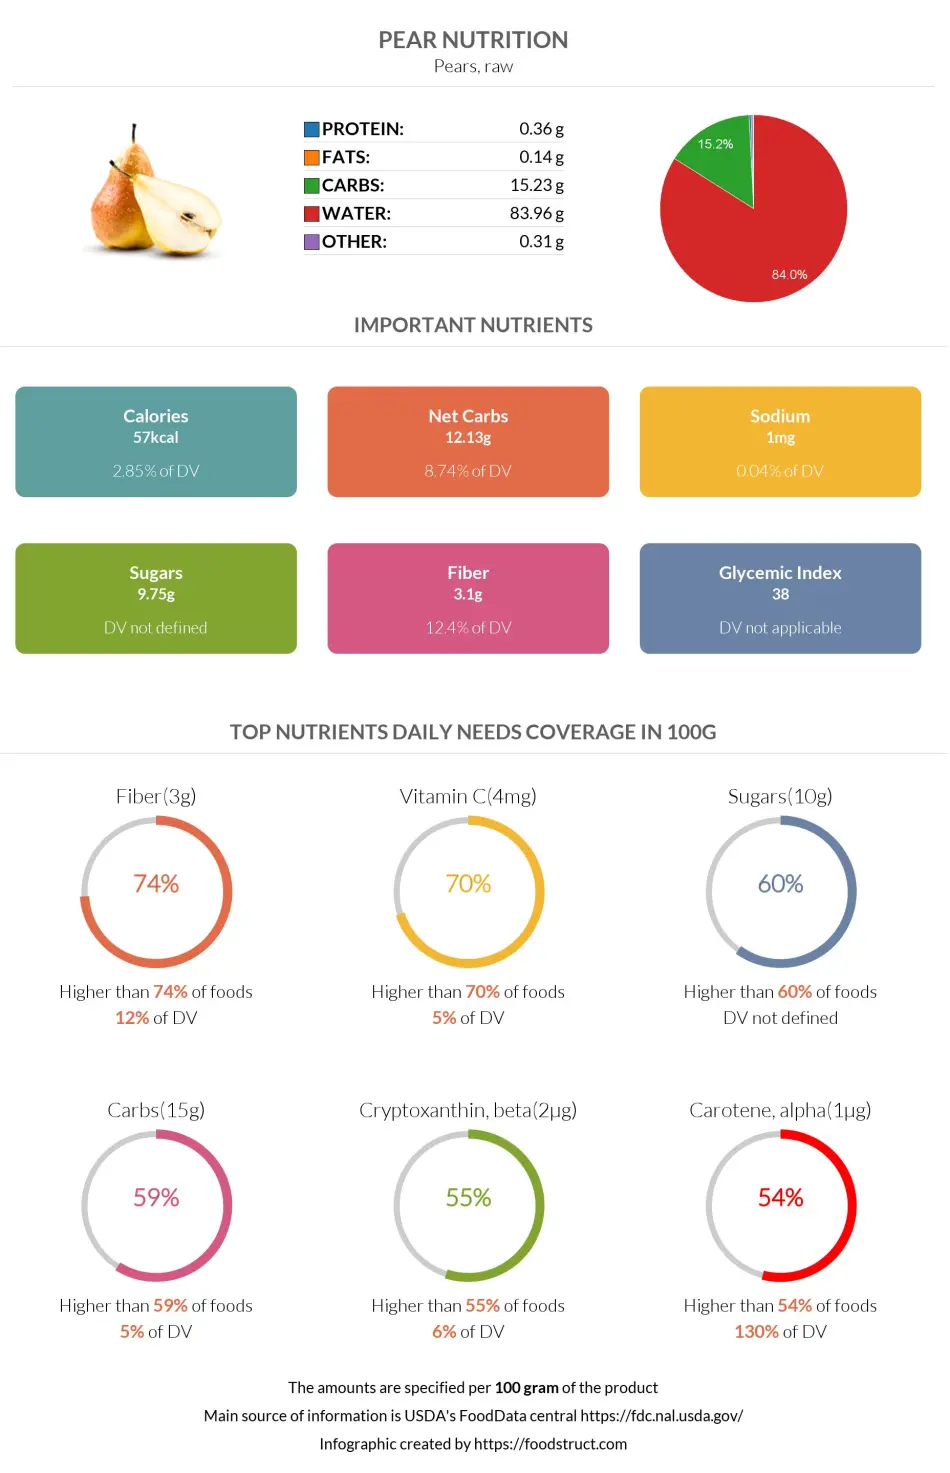
The main element that a pear contains, like most fruits, is water. Pears consist of 84% water.
Macronutrients chart
Carbohydrates in a Pear
A 100g pear contains 15g of carbohydrates. Out of this, the dietary fiber comprises 3g, and total sugars make up another 10g. A pear also contains 1g of added sugars
Of all sugars, pears are particularly rich in fructose and sorbitol compared to other fruits (3).
One average serving of a pear is a source of 25g of carbohydrates.
Carbohydrate type breakdown
Proteins and Fats in a Pear
A 100g pear contains less than one gram of protein and fats.
However small the amount, the primary type of fats found in pear is the healthy polyunsaturated fatty acids, followed by monounsaturated fatty acids. Pears are very low in saturated fats and naturally do not contain cholesterol.
Fat type information
Pear also contains minimal amounts of all essential amino acids except methionine and histidine.
Vitamins
Among all vitamins, pears are the best source of vitamin C. Pears are also relatively high in vitamins A and K.
Pears contain moderate to low amounts of vitamin B9 (folate), vitamin E, vitamins B6, B3, B2, B1, and B5.
All vitamins are more concentrated in the skin (3).
However, pears completely lack vitamin B12 and vitamin D.
Vitamin coverage chart
Minerals
Pears are rich in copper and magnesium. They also contain some amounts of calcium, potassium, magnesium, iron, zinc, choline, phosphorus, and selenium.
Pears are low in sodium.
Mineral coverage chart
Phytonutrients
Being fruits, pears are packed with highly healthy plant chemicals - phytonutrients. Three major antioxidants are present in pears: polyphenols, terpenoids, and flavonoids.
Pears contain 17.9mg of polyphenols per 1g. These chemicals, as well as terpenoids, have potent antioxidant and anti-inflammatory effects (30).
Pears are members of the Rosaceae family, so they have one of the richest flavonoid contents among the fruits. They contain anthocyanins, flavonols, and proanthocyanidins, with a powerful antioxidant capacity (31).
FODMAPs
FODMAPs are short-chain sugars that the small intestine absorbs poorly. They stay in the digestive tract and cause irritable bowel syndrome with symptoms like diarrhea, cramping, stomach ache, etc.
Fructose is one of the most famous FODMAPs. Pears contain 6.42g of fructose per 100g. People with irritable bowel syndrome should consider FODMAP content before pear consumption.
Oxalates
Oxalates are organic acids found in fruits and vegetables that may bind to calcium ions in the organism and cause kidney stones.
Pears are considered low-oxalate foods. Pear oxalate content equals 4mg per 100g of fruit.
Glycemic Index
The glycemic index of a pear can differ depending on the conditions in which it was grown. The mean of four studies, including different varieties of pears from 3 different countries, makes the average glycemic index of a raw pear equal to 38±2 (1).
The glycemic index of a pear canned in its juice is 44, whereas pears canned in reduced-sugar syrup have a glycemic index of 25±6.
Dried pears from the UK have a glycemic index ranging around 43±15 (2).
Pear is classified as a food with a low glycemic index.
Acidity
Fruits, in general, tend to be more acidic. Pears have a pH of 3 to 4, making this fruit acidic (25).
Inside the human body, pears have been calculated to have a potential renal acid load (PRAL) of -2.1, making it alkaline-forming.
Health Impact
Pears are one of the oldest fruits cultivated by man. Historically, the pear has often been used in traditional medicine for its reported anti-inflammatory, antihyperglycemic, and diuretic qualities. Pears have also been used to relieve cough, as a remedy for alcohol hangovers, and as a laxative (3).
Heart Health
Cardiovascular disease is the leading cause of death globally. The proper diet can make all the difference in the early prevention of cardiovascular disease development.
Antioxidant Effects
Pears are rich in phytochemicals with strong antioxidant properties, providing between 27 and 41mg of phenolics per 100g (3).
The antioxidant content of pears can differ depending on the pear variety. One study compared the antioxidant abilities of 10 different pear varieties and found that Yaguang, Hongpi, Qingpi, and Guifei varieties contained relatively more total phenolic, total flavonoids, and total triterpene, showing stronger antioxidant and anti-inflammatory activities. Lvbaoshi and Youran varieties appeared to be the weakest among them. All the chemical components found in the pear peel were approximately 6 to 20 times higher than those in the flesh of the pear (4).
Pear pomace water extract has also been shown to be a valuable natural source of antioxidants (5).
Effects on Lipid Metabolism
Diets supplemented with pears have improved lipid metabolism and increased the plasma antioxidant potential in rats fed with added cholesterol (6).
Fruit consumption may affect smokers and non-smokers differently. One study found that pear consumption increased total antioxidant capacity in non-smokers but not smokers. In non-smokers, total cholesterol, high-density lipoprotein, and low-density lipoprotein increased significantly, while in smokers, total cholesterol and low-density lipoprotein levels decreased (7).
Diabetes
Epidemiological studies have demonstrated significant evidence of an inverse association between pear consumption and the risk of type 2 diabetes mellitus. Pear intake was estimated to have an 18% reduction in type 2 diabetes risk (8).
Pears are said to have this antidiabetic quality due to their concentration of anthocyanins (9).
Antihyperglycemic Effects
Aqueous and ethanolic peel and pulp extracts from 8 different pear varieties have been demonstrated to possess antihyperglycemic qualities due to the phenolic content. Pears can be included in a healthy diet for people with type 2 diabetes to help manage the early stages of hyperglycemia (10).
Pear extract also improves impaired glucose tolerance and insulin resistance (11).
Antiobesity Effects
A clinical study has concluded that pear consumption can be associated with weight reduction (12).
Pear extract supplementation has been shown to ameliorate diet‐induced obesity and associated metabolic complications. Both pear fruits and malaxinic acid, found in a pear’s composition, suggest health-beneficial effects that counteract these diseases (11).
Cancer
Diets rich in various fruits and vegetables have lowered the risk of developing cancer.
Higher consumption of pears has been studied to decrease lung cancer incidence (13).
The Nordic diet that includes high consumption of pears, among other foods, has been found to lower the risk of colorectal cancer development in women (14).
Another study found a protective association between the intake of fruits from the Rosaceae family, such as pears, and esophageal squamous cell carcinoma (15).
Allergy
As healthy as a pear can be, it can also be hazardous for people who are intolerant of it.
There are two different types of pear allergies. The first form is called birch-fruit syndrome and is a form of cross-reactivity between birch pollen and fruit such as pears. This allergy is more common in the North of Europe, and the allergen that causes it is intolerant to high temperatures. This means that people with a birch-pear allergy can often eat pears in cooked forms. This allergy also has been found to commonly have cross-reactions within other fruits, such as apples, apricots, cherries, melons, bananas, nuts, etc. (16).
The second form of this allergy often causes more severe reactions and has no cross-sensitivity to birch pollen. However, people with this allergy are commonly also allergic to peaches. The fruit’s peel can be more allergenic than the flesh, and the allergen survives processing, so even cooking does not destroy it. This allergy is more common in Mediterranean countries (16).
The allergens found in pears are called Pyr c 1, Pyr c 3, Pyr c 4, and Pyr c 5 proteins and reside both in the flesh and in the pulp. However, these proteins are concentrated in the peel, so the peel tends to be more allergy-inducing (17).
The general symptoms can range from mild to severe. These include oral allergy syndrome (itching, swelling, and redness of the oral area), itching of the eyes and throat, contact dermatitis, nausea, stomach pains, diarrhea, and in rare cases, anaphylactic shock.
Pears in Diets
| Keto | One average pear contains 25g of carbohydrates. Since the keto diet allows only 5 to 10% (20 to 50g) of your daily caloric intake to consist of carbohydrates (18), pears are not considered to be keto-friendly (19). |
| DASH | Pears are low in sodium and high in fiber, containing moderate amounts of calcium, magnesium, and potassium. Due to these characteristics, pears suit the DASH diet. |
| Atkins | Pears containing 15g of carbohydrates per 100g are considered to be high-carb fruits and are only allowed in the Induction phase of this diet and in moderation. Overall, it is advised to avoid this fruit during the Atkins diet. |
| Mediterranean | Fruits are essential to the Mediterranean diet. Pears are also included in the traditional version of this diet (20). |
| Paleo | Most fruits and vegetables are included in the paleo diet. Pears fit this diet but only in moderation. |
| Vegan/ Vegetarian/ Pescetarian | Pears being fruits, naturally fit in all three diets. |
| Dukan | Pears are not allowed in the first two, Attack and Cruise phases of this diet. Starting from the Consolidation phase, you can add pears in limited amounts to your diet. In fact, pears are one of the best fruits to add during this phase (21). |
| Intermittent Fasting | Like most fruits, you can use pears during the eating periods, but not during the fasting periods. |
| Low Fat & Low Calorie | Pears are very low in fats but contain 97 calories per serving. You can have pears during low-fat diets and use them in moderation in low-calorie diets. |
| Low Carb | A serving of pear contains 25g of carbohydrates. Pears are not advisable to use during low-carb diets. |
| Anti Inflammatory | Studies have found pear to have certain anti-inflammatory qualities due to its phytochemical content (3). Therefore, pears can be a healthy option during this diet. |
| BRAT | Raw pears are high in fiber and sugar and are to be avoided. However, you can have pear juice in the first 8 to 12 hours of this diet and can add canned pears, preferably in natural juice, during the next 12 to 24 hours of this diet (22). |
Nordic Diet
The Nordic diet is based on traditional ways of eating in the Nordic countries, which include Denmark, Norway, Sweden, Finland, and Iceland. It has been studied to have positive effects on the environment and health, lowering mortality rates (23).
Nordic diet staples include whole-grain cereals such as rye, barley, and oats; berries and other fruits; vegetables (especially cabbage and root vegetables like potatoes and carrots); fatty fish such as salmon, mackerel, and herring; and legumes (beans and peas) (24).
Pears and apples are an essential part of this diet.
Cooking
Pears are more often eaten raw but can also be used in salads, pastries, and desserts.
Keeping, Storing, and Conservation
The storage of pears can affect their antioxidant capacity, and it is important to use pears correctly in order to not waste their beneficial qualities on health.
Ripe pears should be refrigerated at 2 to 7°C (35 to 45°F) and at 85% to 90% humidity. Unripe pears can be kept at room temperature to ripen. However, pears ripen from the inside out, so the pulp can already be overripe when the peel gets soft. The ripeness of pears can be checked by applying pressure to the neck of the fruit. If it gives slightly to pressure, it is already ripe. You can also speed up the ripening process by keeping pears close to avocados or bananas (26).
You can also freeze pears to lengthen the storage period; however, they may lose some nutrients.
After one week of domestic storage, the ascorbic acid content decreased by 75%. Peeling led to a more than 25% decrease in total phenolics and ascorbic acid (27). So it is recommended to consume pears shortly after buying, preferably with peel.
Consumption and Production
In 2012, the US per-capita consumption of fresh pears was 2.8 lb (1.3 kg), according to the USDA National Agricultural Statistics Service. The per-capita consumption of all pear products was about 7 lb (3 kg) in 2010. About 60% of the US pear crop is sold as fresh, and 40% is processed, primarily in the form of canned products. The United States is a net exporter of pears (3).
With approximately 17 million tonnes of pear production per year, China is the largest pear-producing country worldwide, comprising around 68% of total production. The country that follows is Argentina with 954K tonnes, followed by Italy with 767K tonnes of pear production per year (28).
China is also the largest consumer of pears, accounting for nearly 66% of total consumption. The second-largest consumer in the world is Italy, followed by the USA.
Overall, the global pear market revenue in 2018 amounted to 27.3 billion dollars (28).
Varieties
There are estimated to be over 3,000 varieties of pears; however, only about a hundred of them are commercially popular.
The ten main varieties grown in the United States are Green and Red Anjou, Bartlett and Red Bartlett, Bosc, Comice, Forelle, Seckel, Starkrimson, and Concorde (3).
The varieties mainly differ in their softness and sweetness. The Bartlett, Red Bartlett, Comice, and Starkrimson are soft, juicy, and sweet, whereas Forelle, Seckel, and Bosc are crispy and less sweet (29).
Whatever the variety, the nutrition of pears makes this fruit an excellent choice for most health-conscious consumers.
Seasonality
There are a lot of well-known varieties of pears in the US, although many people do not even know their names: Red and Green Anjou, Bartlett, Bosc, Comice, Concorde, Forelle, etc.
Bosc and Seckel varieties have the most crispy texture, while Starkrimson and Bartlett are the juiciest and sweetest when ripe.
Starkrimson is usually a summer pear, while Bartlett is commonly harvested in late September and is available in markets even during December. Anjou pears are perfect for salads or slicing into different desserts. They are available in September or early October (29).
References
- https://care.diabetesjournals.org/content/diacare/suppl/2008/09/18/dc08-1239.DC1/TableA2_1.pdf
- https://care.diabetesjournals.org/content/diacare/suppl/2008/09/18/dc08-1239.DC1/TableA1_1.pdf
- https://www.ncbi.nlm.nih.gov/pmc/articles/PMC4657810/
- https://pubmed.ncbi.nlm.nih.gov/24444971/
- https://pubmed.ncbi.nlm.nih.gov/30263606/
- https://pubmed.ncbi.nlm.nih.gov/12550072/
- https://pubmed.ncbi.nlm.nih.gov/20109132/
- https://www.researchgate.net/publication/312644914
- https://www.ncbi.nlm.nih.gov/pmc/articles/PMC3302366/
- https://onlinelibrary.wiley.com/doi/abs/10.1111/j.1745-4514.2012.00665.x
- https://onlinelibrary.wiley.com/doi/abs/10.1002/mnfr.201801347
- https://pubmed.ncbi.nlm.nih.gov/18439712/
- https://pubmed.ncbi.nlm.nih.gov/17487840/
- https://pubmed.ncbi.nlm.nih.gov/22874538/
- https://pubmed.ncbi.nlm.nih.gov/17691111/
- http://research.bmh.manchester.ac.uk/informall/allergenic-food/index.aspx?FoodId=39
- https://allergy-symptoms.org/pear-allergy/
- https://www.hsph.harvard.edu/nutritionsource/healthy-weight/diet-reviews/ketogenic-diet/
- https://isitketo.org/pears
- https://oldwayspt.org/traditional-diets/mediterranean-diet/traditional-med-diet
- https://www.weightlossresources.co.uk/diet/pierre-dukan-diet/consolidation-phase.htm
- https://newscenter.sdsu.edu/student_affairs/healthpromotion/files/03710-BRAT_Diet_07-2012.pdf
- https://academic.oup.com/jn/article/141/4/639/4743736
- https://www.health.harvard.edu/blog/the-nordic-diet-healthy-fare-with-an-eco-friendly-bent-201511198673
- https://goaskalice.columbia.edu/answered-questions/which-foods-are-acidic
- https://www.stemilt.com/pear-storage/
- https://pubs.acs.org/doi/abs/10.1021/jf201013k
- https://www.globaltrademag.com/global-pear-market-russia-indonesia-and-germany-are-the-largest-importers-in-the-world/
- https://usapears.org/pear-varieties/
- https://www.ncbi.nlm.nih.gov/pmc/articles/PMC6337724/#:~:text=Polyphenols%2C%20the%20major%20functional%20ingredients,%2Dinflammatory%20properties%20%5B7%5D.
- https://www.ncbi.nlm.nih.gov/pmc/articles/PMC4657810/

Important nutritional characteristics for Pear
|
Glycemic index ⓘ
Source:
Asian pear 18 https://www.ncbi.nlm.nih.gov/pmc/articles/PMC3208016/
Check out our Glycemic index chart page for the full list.
|
38 (low) |
| Glycemic load | 8 (low) |
| Insulin index ⓘ Falls in a large range https://synapse.koreamed.org/articles/1043926 | 45 |
| Calories ⓘ Calories per 100-gram serving | 57 |
| Net Carbs ⓘ Net Carbs = Total Carbohydrates – Fiber – Sugar Alcohols | 12.13 grams |
| Serving Size ⓘ Serving sizes are taken from FDA's Reference Amounts Customarily Consumed (RACCs) | 1 NLEA serving (166 grams) |
| Acidity (Based on PRAL) ⓘ PRAL (Potential renal acid load) is calculated using a formula. On the PRAL scale the higher the positive value, the more is the acidifying effect on the body. The lower the negative value, the higher the alkalinity of the food. 0 is neutral. | -2.1 (alkaline) |
| Oxalates ⓘ https://www.sciencedirect.com/science/article/abs/pii/S0889157513000902 | 4mg |
Pear calories (kcal)
| Serving Size | Calories | Weight |
|---|---|---|
| Calories in 100 grams | 57 | |
| Calories in 1 cup, slices | 80 | 140 g |
| Calories in 1 cup, cubes | 92 | 161 g |
| Calories in 1 small | 84 | 148 g |
| Calories in 1 medium | 101 | 178 g |
| Calories in 1 large | 131 | 230 g |
| Calories in 1 NLEA serving | 95 | 166 g |
Pear Glycemic index (GI)
Pear Glycemic load (GL)
Mineral chart - relative view
Vitamin chart - relative view
Protein quality breakdown
Fiber content ratio for Pear
All nutrients for Pear per 100g
| Nutrient | Value | DV% | In TOP % of foods | Comparison |
| Calories | 57kcal | 3% | 84% |
1.2 times more than Orange
|
| Protein | 0.36g | 1% | 92% |
7.8 times less than Broccoli
|
| Fats | 0.14g | 0% | 90% |
237.9 times less than Cheddar Cheese
|
| Vitamin C | 4.3mg | 5% | 30% |
12.3 times less than Lemon
|
| Net carbs | 12.13g | N/A | 42% |
4.5 times less than Chocolate
|
| Carbs | 15.23g | 5% | 41% |
1.8 times less than Rice
|
| Cholesterol | 0mg | 0% | 100% |
N/A
|
| Vitamin D | 0µg | 0% | 100% |
N/A
|
| Iron | 0.18mg | 2% | 90% |
14.4 times less than Beef broiled
|
| Calcium | 9mg | 1% | 79% |
13.9 times less than Milk
|
| Potassium | 116mg | 3% | 79% |
1.3 times less than Cucumber
|
| Magnesium | 7mg | 2% | 89% |
20 times less than Almond
|
| Sugar | 9.75g | N/A | 40% |
1.1 times more than Coca-Cola
|
| Fiber | 3.1g | 12% | 26% |
1.3 times more than Orange
|
| Copper | 0.08mg | 9% | 61% |
1.7 times less than Shiitake
|
| Zinc | 0.1mg | 1% | 91% |
63.1 times less than Beef broiled
|
| Phosphorus | 12mg | 2% | 92% |
15.2 times less than Chicken meat
|
| Sodium | 1mg | 0% | 98% |
490 times less than White Bread
|
| Vitamin A | 25IU | 1% | 57% |
668.2 times less than Carrot
|
| Vitamin A RAE | 1µg | 0% | 72% | |
| Vitamin E | 0.12mg | 1% | 84% |
12.2 times less than Kiwifruit
|
| Selenium | 0.1µg | 0% | 96% | |
| Manganese | 0.05mg | 2% | 67% | |
| Vitamin B1 | 0.01mg | 1% | 91% |
22.2 times less than Pea raw
|
| Vitamin B2 | 0.03mg | 2% | 89% |
5 times less than Avocado
|
| Vitamin B3 | 0.16mg | 1% | 89% |
59.5 times less than Turkey meat
|
| Vitamin B5 | 0.05mg | 1% | 94% |
23.1 times less than Sunflower seed
|
| Vitamin B6 | 0.03mg | 2% | 88% |
4.1 times less than Oat
|
| Vitamin B12 | 0µg | 0% | 100% |
N/A
|
| Vitamin K | 4.4µg | 4% | 57% |
23.1 times less than Broccoli
|
| Folate | 7µg | 2% | 72% |
8.7 times less than Brussels sprout
|
| Trans Fat | 0g | N/A | 100% |
N/A
|
| Saturated Fat | 0.02g | 0% | 90% |
268 times less than Beef broiled
|
| Monounsaturated Fat | 0.08g | N/A | 82% |
116.7 times less than Avocado
|
| Polyunsaturated fat | 0.09g | N/A | 86% |
501.9 times less than Walnut
|
| Tryptophan | 0mg | 0% | 98% |
152.5 times less than Chicken meat
|
| Threonine | 0.01mg | 0% | 98% |
65.5 times less than Beef broiled
|
| Isoleucine | 0.01mg | 0% | 98% |
83.1 times less than Salmon raw
|
| Leucine | 0.02mg | 0% | 98% |
127.9 times less than Tuna Bluefin
|
| Lysine | 0.02mg | 0% | 98% |
26.6 times less than Tofu
|
| Methionine | 0mg | 0% | 98% |
48 times less than Quinoa
|
| Phenylalanine | 0.01mg | 0% | 98% |
60.7 times less than Egg
|
| Valine | 0.02mg | 0% | 97% |
119.4 times less than Soybean raw
|
| Histidine | 0mg | 0% | 99% |
374.5 times less than Turkey meat
|
| Fructose | 6.42g | 8% | 81% |
1.1 times more than Apple
|
| Omega-3 - EPA | 0g | N/A | 100% |
N/A
|
| Omega-3 - DHA | 0g | N/A | 100% |
N/A
|
| Omega-3 - DPA | 0g | N/A | 100% |
N/A
|
Check out similar food or compare with current
NUTRITION FACTS LABEL
Serving Size ______________
Health checks
Pear nutrition infographic
References
All the values for which the sources are not specified explicitly are taken from FDA’s Food Central. The exact link to the food presented on this page can be found below.