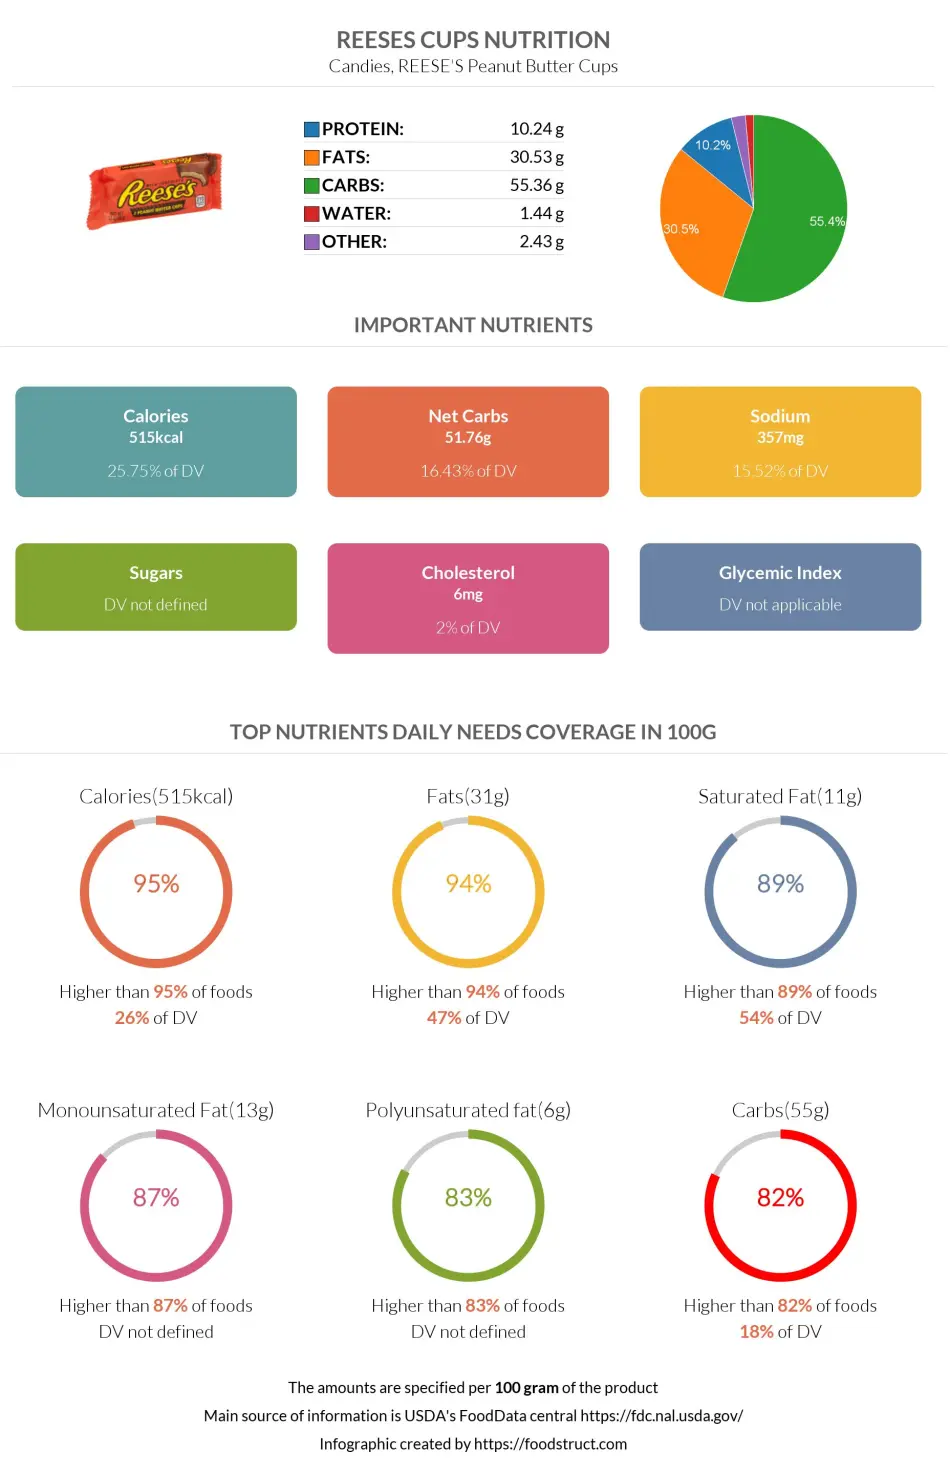
Reeses cups nutrition: calories, carbs, GI, protein, fiber, fats
Candies, REESE'S Peanut Butter Cups
*all the values are displayed for the amount of 100 grams
Important nutritional characteristics for Reeses cups

| Calories ⓘ Calories per 100-gram serving | 515 |
| Net Carbs ⓘ Net Carbs = Total Carbohydrates – Fiber – Sugar Alcohols | 51.76 grams |
| Serving Size ⓘ Serving sizes are taken from FDA's Reference Amounts Customarily Consumed (RACCs) | 1 package 0.6 oz 1 cup (17 grams) |
| Acidity (Based on PRAL) ⓘ PRAL (Potential renal acid load) is calculated using a formula. On the PRAL scale the higher the positive value, the more is the acidifying effect on the body. The lower the negative value, the higher the alkalinity of the food. 0 is neutral. | 1.1 (acidic) |
Calories ⓘHigher in Calories content than 95% of foods
Fats ⓘHigher in Fats content than 94% of foods
Saturated Fat ⓘHigher in Saturated Fat content than 89% of foods
Monounsaturated Fat ⓘHigher in Monounsaturated Fat content than 87% of foods
Polyunsaturated fat ⓘHigher in Polyunsaturated fat content than 83% of foods
Reeses cups calories (kcal)
| Serving Size | Calories | Weight |
|---|---|---|
| Calories in 100 grams | 515 | |
| Calories in 1 package 0.6 oz 1 cup | 88 | 17 g |
| Calories in 1 package 1.6 oz 2 cups | 232 | 45 g |
| Calories in 1 miniature | 36 | 7 g |
Mineral coverage chart
Calcium:
78 mg of 1,000 mg
8%
Iron:
1.21 mg of 8 mg
15%
Magnesium:
62 mg of 420 mg
15%
Phosphorus:
161 mg of 700 mg
23%
Potassium:
343 mg of 3,400 mg
10%
Sodium:
357 mg of 2,300 mg
16%
Zinc:
1.28 mg of 11 mg
12%
Copper:
0.24 mg of 1 mg
27%
Manganese:
0 mg of 2 mg
0%
Selenium:
1.4 µg of 55 µg
3%
Choline:
35.4 mg of 550 mg
6%
Mineral chart - relative view
Magnesium
62 mg
TOP 19%
Calcium
78 mg
TOP 26%
Potassium
343 mg
TOP 27%
Copper
0.24 mg
TOP 28%
Sodium
357 mg
TOP 29%
Zinc
1.28 mg
TOP 49%
Phosphorus
161 mg
TOP 50%
Iron
1.21 mg
TOP 54%
Choline
35.4 mg
TOP 68%
Selenium
1.4 µg
TOP 80%
Manganese
0 mg
TOP 100%
Vitamin coverage chart
Vitamin A:
56 IU of 5,000 IU
1%
Vitamin E :
0.15 mg of 15 mg
1%
Vitamin D:
0 µg of 10 µg
0%
Vitamin C:
0.3 mg of 90 mg
0%
Vitamin B1:
0.16 mg of 1 mg
13%
Vitamin B2:
0.11 mg of 1 mg
8%
Vitamin B3:
4.49 mg of 16 mg
28%
Vitamin B5:
0.62 mg of 5 mg
12%
Vitamin B6:
0.1 mg of 1 mg
8%
Folate:
50 µg of 400 µg
13%
Vitamin B12:
0.26 µg of 2 µg
11%
Vitamin K:
2 µg of 120 µg
2%
Vitamin chart - relative view
Folate
50 µg
TOP 35%
Vitamin B3
4.49 mg
TOP 37%
Vitamin B1
0.16 mg
TOP 38%
Vitamin A
56 IU
TOP 48%
Vitamin C
0.3 mg
TOP 50%
Vitamin B5
0.62 mg
TOP 51%
Vitamin B12
0.26 µg
TOP 56%
Vitamin K
2 µg
TOP 65%
Vitamin B6
0.1 mg
TOP 65%
Vitamin B2
0.11 mg
TOP 66%
Vitamin E
0.15 mg
TOP 81%
Vitamin D
0 µg
TOP 100%
Macronutrients chart
Protein:
Daily Value: 20%
10.24 g of 50 g
20%
Fats:
Daily Value: 47%
30.53 g of 65 g
47%
Carbs:
Daily Value: 18%
55.36 g of 300 g
18%
Water:
Daily Value: 0%
1.44 g of 2,000 g
0%
Other:
2.43 g
Fat type information
Saturated Fat:
10.73 g
Monounsaturated Fat:
13.1 g
Polyunsaturated fat:
5.5 g
Fiber content ratio for Reeses cups
Sugar:
47.17 g
Fiber:
3.6 g
Other:
4.59 g
All nutrients for Reeses cups per 100g
| Nutrient | Value | DV% | In TOP % of foods | Comparison |
| Calories | 515kcal | 26% | 5% |
11 times more than Orange
|
| Protein | 10.24g | 24% | 44% |
3.6 times more than Broccoli
|
| Fats | 30.53g | 47% | 6% |
1.1 times less than Cheddar Cheese
|
| Vitamin C | 0.3mg | 0% | 50% |
176.7 times less than Lemon
|
| Net carbs | 51.76g | N/A | 18% |
Equal to Chocolate
|
| Carbs | 55.36g | 18% | 18% |
2 times more than Rice
|
| Cholesterol | 6mg | 2% | 51% |
62.2 times less than Egg
|
| Vitamin D | 0µg | 0% | 100% |
N/A
|
| Iron | 1.21mg | 15% | 54% |
2.1 times less than Beef broiled
|
| Calcium | 78mg | 8% | 26% |
1.6 times less than Milk
|
| Potassium | 343mg | 10% | 27% |
2.3 times more than Cucumber
|
| Magnesium | 62mg | 15% | 19% |
2.3 times less than Almond
|
| Sugar | 47.17g | N/A | 24% |
5.3 times more than Coca-Cola
|
| Fiber | 3.6g | 14% | 23% |
1.5 times more than Orange
|
| Copper | 0.24mg | 27% | 28% |
1.7 times more than Shiitake
|
| Zinc | 1.28mg | 12% | 49% |
4.9 times less than Beef broiled
|
| Phosphorus | 161mg | 23% | 50% |
1.1 times less than Chicken meat
|
| Sodium | 357mg | 16% | 29% |
1.4 times less than White Bread
|
| Vitamin A | 56IU | 1% | 48% |
298.3 times less than Carrot
|
| Vitamin A RAE | 17µg | 2% | 45% | |
| Vitamin E | 0.15mg | 1% | 81% |
9.7 times less than Kiwifruit
|
| Selenium | 1.4µg | 3% | 80% | |
| Manganese | 0mg | 0% | 100% | |
| Vitamin B1 | 0.16mg | 13% | 38% |
1.7 times less than Pea raw
|
| Vitamin B2 | 0.11mg | 8% | 66% |
1.2 times less than Avocado
|
| Vitamin B3 | 4.49mg | 28% | 37% |
2.1 times less than Turkey meat
|
| Vitamin B5 | 0.62mg | 12% | 51% |
1.8 times less than Sunflower seed
|
| Vitamin B6 | 0.1mg | 8% | 65% |
1.2 times less than Oat
|
| Vitamin B12 | 0.26µg | 11% | 56% |
2.7 times less than Pork
|
| Vitamin K | 2µg | 2% | 65% |
50.8 times less than Broccoli
|
| Folate | 50µg | 13% | 35% |
1.2 times less than Brussels sprout
|
| Trans Fat | 0g | N/A | 100% |
N/A
|
| Saturated Fat | 10.73g | 54% | 11% |
1.8 times more than Beef broiled
|
| Monounsaturated Fat | 13.1g | N/A | 13% |
1.3 times more than Avocado
|
| Polyunsaturated fat | 5.5g | N/A | 17% |
8.6 times less than Walnut
|
| Omega-3 - EPA | 0g | N/A | 100% |
N/A
|
| Omega-3 - DHA | 0g | N/A | 100% |
N/A
|
| Omega-3 - DPA | 0g | N/A | 100% |
N/A
|
| Omega-6 - Eicosadienoic acid | 0g | N/A | 100% |
Check out similar food or compare with current
NUTRITION FACTS LABEL
Nutrition Facts
___servings per container
Serving Size ______________
Serving Size ______________
Amount Per 100g
Calories 515
% Daily Value*
48%
Total Fat
31g
50%
Saturated Fat 11g
2%
Cholesterol 6mg
16%
Sodium 357mg
18%
Total Carbohydrate
55g
16%
Dietary Fiber
4g
Total Sugars g
Includes ? g Added Sugars
Protein
10g
Vitamin D
0mcg
0%
Calcium
78mg
8%
Iron
1mg
13%
Potassium
343mg
10%
*
The % Daily Value (DV) tells you how much a nutrient in a serving of food contributes to a daily diet. 2,000 calories a day is used for general nutrition advice.
Health checks
Low in Cholesterol
ⓘ
Dietary cholesterol is not associated with an increased risk of coronary heart disease in healthy individuals. However, dietary cholesterol is common in foods that are high in harmful saturated fats.
Source
No Trans Fats
ⓘ
Trans fat consumption increases the risk of cardiovascular disease and mortality by negatively affecting blood lipid levels.
Source
Low in Saturated Fats
ⓘ
Saturated fat intake can raise total cholesterol and LDL (low-density lipoprotein) levels, leading to an increased risk of atherosclerosis. Dietary guidelines recommend limiting saturated fats to under 10% of calories a day.
Source
Low in Sugars
ⓘ
While the consumption of moderate amounts of added sugars is not detrimental to health, an excessive intake can increase the risk of obesity, and therefore, diabetes.
Source
Reeses cups nutrition infographic
Infographic link
References
All the values for which the sources are not specified explicitly are taken from FDA’s Food Central. The exact link to the food presented on this page can be found below.