
Համեմատել Beverages, Tropical Punch, ready-to-drink և Perrier սննդամթերքների վիտամինները և միներալները
Համեմատել
Infographic
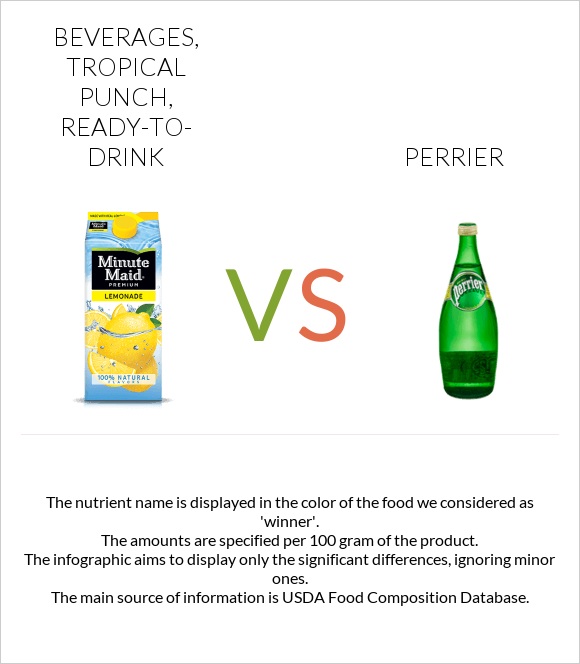
Infographic link
Mineral Comparison
The mineral comparison score is based on which food has a more favorable amount of each mineral. The �coverage� charts below show how much of the daily mineral needs are covered by the selected amount of each food.
| Պարունակում է ավելի շատ ԿալցիումԿալցիում | +∞% |
| Պարունակում է ավելի քիչ ՆատրիումՆատրիում | -92.3% |
Vitamin Comparison
The vitamin comparison score is based on the number of vitamins in which one food is richer than the other. The �coverage� charts below show how much of the daily vitamin needs are covered by the selected amount of each food.
All nutrients comparison - raw data values
| Nutrient |  |
 |
DV% diff. |
| Կալորիականություն | 10kcal | 0kcal | 1% |
| Ածխաջրեր | 2.5g | 0g | 1% |
| Կալցիում | 0mg | 14mg | 1% |
| Նատրիում | 13mg | 1mg | 1% |
| Weight per 100 calories | 1000g | N/A | |
| Զուտ ածխաջրեր | 2.5g | 0g | N/A |
| Շաքար | 2.5g | N/A |
Macronutrient Comparison
Macronutrient breakdown side-by-side comparison
Սպիտակուցներ:
0 գ
Ճարպեր:
0 գ
Ածխաջրեր:
2.5 գ
Ջուր:
97.49 գ
Այլ:
0.01 գ
Սպիտակուցներ:
0 գ
Ճարպեր:
0 գ
Ածխաջրեր:
0 գ
Ջուր:
99.9 գ
Այլ:
0.1 գ
| Պարունակում է ավելի շատ ԱծխաջրերԱծխաջրեր | +∞% |
հավասար
Սպիտակուցներ
~0g
հավասար
Ճարպեր
~0g
հավասար
Ջուր
~99.9g