Համեմատել Բրնձի յուղ և Ձկան յուղ սննդամթերքների վիտամինները և միներալները
Համեմատել
Infographic
Infographic link
Mineral Comparison
Mineral comparison score is based on the number of minerals by which one or the other food is richer. The "coverage" charts below show how much of the daily needs can be covered by 300 grams of the food.
| Պարունակում է ավելի շատ ԵրկաթԵրկաթ | +∞% |
Vitamin Comparison
Vitamin comparison score is based on the number of vitamins by which one or the other food is richer. The "coverage" charts below show how much of the daily needs can be covered by 300 grams of the food.
| Պարունակում է ավելի շատ Վիտամին E Վիտամին E | +∞% |
| Պարունակում է ավելի շատ Վիտամին KՎիտամին K | +∞% |
All nutrients comparison - raw data values
| Nutrient |  |
 |
DV% diff. |
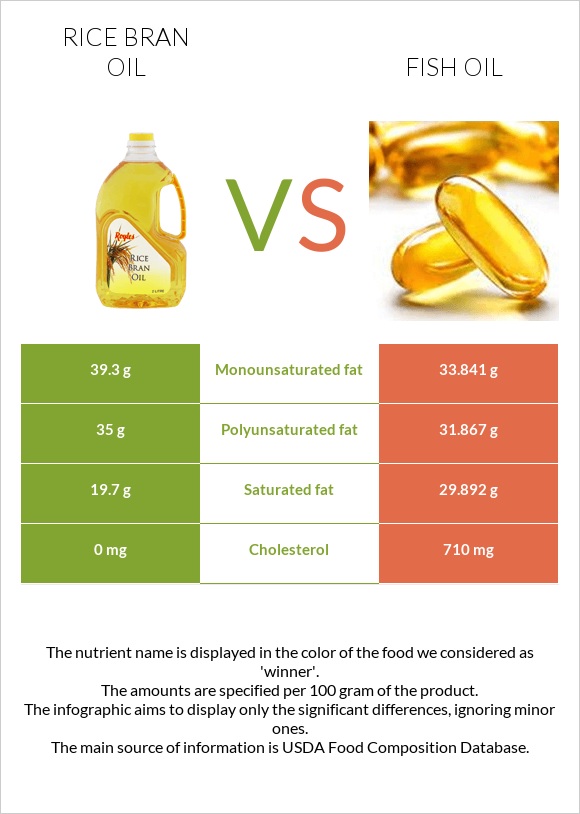
| Խոլեստերին | 0mg | 710mg | 237% |
| Վիտամին E | 32.3mg | 215% | |
| Հագեցած ճարպ | 19.7g | 29.892g | 46% |
| Վիտամին D | 332 IU | 42% | |
| Վիտամին D | 8.3µg | 42% | |
| Վիտամին K | 24.7µg | 21% | |
| Պոլիչհագեցած ճարպ | 35g | 31.867g | 21% |
| Մոնոչհագեցած ճարպ | 39.3g | 33.841g | 14% |
| Կալորիականություն | 884kcal | 902kcal | 1% |
| Երկաթ | 0.07mg | 0mg | 1% |
| Weight per 100 calories | 11g | 11g | N/A |
| Ճարպեր | 100g | 100g | 0% |
| Unsaturated / Saturated Fat ratio | 3.8 | 2.2 | N/A |
| 20:5 n-3 (EPA) | 0g | 10.137g | N/A |
| 22:6 n-3 (DHA) | 0g | 10.656g | N/A |
| 22:5 n-3 (DPA) | 0g | 1.973g | N/A |
Macronutrient Comparison
Macronutrient breakdown side-by-side comparison
Սպիտակուցներ:
0 գ
Ճարպեր:
100 գ
Ածխաջրեր:
0 գ
Ջուր:
0 գ
Այլ:
0 գ
Սպիտակուցներ:
0 գ
Ճարպեր:
100 գ
Ածխաջրեր:
0 գ
Ջուր:
0 գ
Այլ:
0 գ
հավասար
Սպիտակուցներ
~0g
հավասար
Ճարպեր
~100g
հավասար
Ածխաջրեր
~0g
հավասար
Ջուր
~0g
հավասար
Այլ
~0գ
Fat Type Comparison
Fat type breakdown side-by-side comparison
Հագեցած ճարպ:
Հագեցած ճարպ
19.7 գ
Մոնոչհագեցած ճարպ:
Մոնոչհագեցած ճարպ
39.3 գ
Պոլիչհագեցած ճարպ:
Պոլիչհագեցած ճարպ
35 գ
Հագեցած ճարպ:
Հագեցած ճարպ
29.892 գ
Մոնոչհագեցած ճարպ:
Մոնոչհագեցած ճարպ
33.841 գ
Պոլիչհագեցած ճարպ:
Պոլիչհագեցած ճարպ
31.867 գ
| Պարունակում է ավելի քիչ Հագեցած ճարպՀագեցած ճարպ | -34.1% |
| Պարունակում է ավելի շատ Մոնոչհագեցած ճարպՄոնոչհագեցած ճարպ | +16.1% |
հավասար
Պոլիչհագեցած ճարպ
~31.867g


