Chocolate chip cookie vs. Naan — In-Depth Nutrition Comparison
Compare
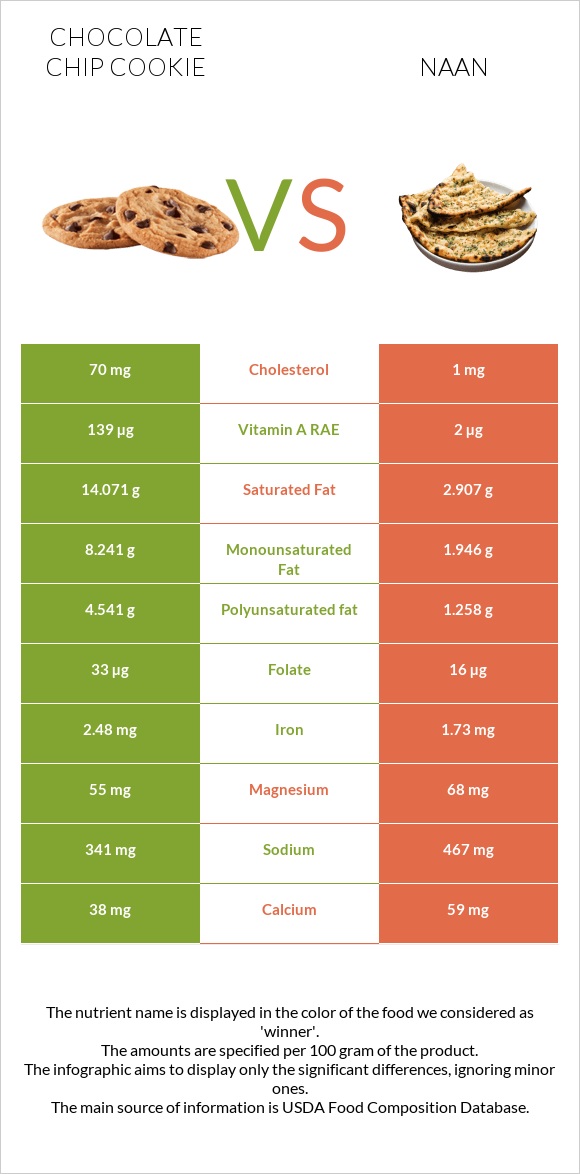
A recap on differences between Chocolate chip cookie and Naan
- Chocolate chip cookie is higher in Copper, Vitamin A RAE, and Iron, yet Naan is higher in Manganese, Vitamin B3, and Phosphorus.
- Chocolate chip cookie covers your daily Saturated Fat needs 56% more than Naan.
- Chocolate chip cookie contains 70 times more Cholesterol than Naan. While Chocolate chip cookie contains 70mg of Cholesterol, Naan contains only 1mg.
Food varieties used in this article are Cookies, chocolate chip, prepared from recipe, made with butter and Bread, naan, whole wheat, commercially prepared, refrigerated.
Infographic
Infographic link
Mineral Comparison
Mineral comparison score is based on the number of minerals by which one or the other food is richer. The "coverage" charts below show how much of the daily needs can be covered by 300 grams of the food.
Contains
more
Iron
+43.4%
Contains
more
Potassium
+19.5%
Contains
less
Sodium
-27%
Contains
more
Copper
+144.3%
Contains
more
Calcium
+55.3%
Contains
more
Magnesium
+23.6%
Contains
more
Phosphorus
+88%
Contains
more
Zinc
+31.9%
Contains
more
Manganese
+111.2%
Equal in Selenium - 11.4
Contains
more
Iron
+43.4%
Contains
more
Potassium
+19.5%
Contains
less
Sodium
-27%
Contains
more
Copper
+144.3%
Contains
more
Calcium
+55.3%
Contains
more
Magnesium
+23.6%
Contains
more
Phosphorus
+88%
Contains
more
Zinc
+31.9%
Contains
more
Manganese
+111.2%
Equal in Selenium - 11.4
Vitamin Comparison
Vitamin comparison score is based on the number of vitamins by which one or the other food is richer. The "coverage" charts below show how much of the daily needs can be covered by 300 grams of the food.
:
Contains
more
Vitamin A
+9800%
Contains
more
Vitamin C
+∞%
Contains
more
Folate
+106.3%
Contains
more
Vitamin B12
+∞%
Contains
more
Vitamin B3
+162.3%
Contains
more
Vitamin B6
+52.4%
Equal in Vitamin B1 - 0.176
Equal in Vitamin B2 - 0.18
Contains
more
Vitamin A
+9800%
Contains
more
Vitamin C
+∞%
Contains
more
Folate
+106.3%
Contains
more
Vitamin B12
+∞%
Contains
more
Vitamin B3
+162.3%
Contains
more
Vitamin B6
+52.4%
Equal in Vitamin B1 - 0.176
Equal in Vitamin B2 - 0.18
Macronutrient Comparison
Macronutrient breakdown side-by-side comparison
Contains
more
Fats
+323.9%
Contains
more
Carbs
+25.9%
Contains
more
Protein
+78.9%
Contains
more
Water
+512.3%
Equal in Other - 1.99
Protein:
5.7 g
Fats:
28.4 g
Carbs:
58.2 g
Water:
5.7 g
Other:
2 g
Protein:
10.2 g
Fats:
6.7 g
Carbs:
46.21 g
Water:
34.9 g
Other:
1.99 g
Contains
more
Fats
+323.9%
Contains
more
Carbs
+25.9%
Contains
more
Protein
+78.9%
Contains
more
Water
+512.3%
Equal in Other - 1.99
Fat Type Comparison
Fat type breakdown side-by-side comparison
Contains
more
Monounsaturated Fat
+323.5%
Contains
more
Polyunsaturated fat
+261%
Contains
less
Saturated Fat
-79.3%
Saturated Fat:
14.071 g
Monounsaturated Fat:
8.241 g
Polyunsaturated fat:
4.541 g
Saturated Fat:
2.907 g
Monounsaturated Fat:
1.946 g
Polyunsaturated fat:
1.258 g
Contains
more
Monounsaturated Fat
+323.5%
Contains
more
Polyunsaturated fat
+261%
Contains
less
Saturated Fat
-79.3%
Comparison summary table
Pay attention to the rightmost column. It displays the amounts side by side, giving a clearer understanding of the difference.
 |
 |
||
| Lower in Cholesterol |
|
||
| Lower in Saturated Fat |
|
||
| Rich in minerals |
|
||
| Lower in Sugar |
|
||
| Lower in Sodium |
|
||
| Lower in Glycemic Index |
|
||
| Lower in price | Equal | ||
| Rich in vitamins | Equal | ||
All nutrients comparison - raw data values
| Nutrient | |
|
Opinion |
| Net carbs | 58.2g | 41.41g |
|
| Protein | 5.7g | 10.2g |
|
| Fats | 28.4g | 6.7g |
|
| Carbs | 58.2g | 46.21g |
|
| Calories | 488kcal | 286kcal |
|
| Starch | 36g |
|
|
| Fructose | 0.8g |
|
|
| Sugar | 3.4g |
|
|
| Fiber | 4.8g |
|
|
| Calcium | 38mg | 59mg |
|
| Iron | 2.48mg | 1.73mg |
|
| Magnesium | 55mg | 68mg |
|
| Phosphorus | 100mg | 188mg |
|
| Potassium | 221mg | 185mg |
|
| Sodium | 341mg | 467mg |
|
| Zinc | 0.94mg | 1.24mg |
|
| Copper | 0.386mg | 0.158mg |
|
| Manganese | 0.663mg | 1.4mg |
|
| Selenium | 11.2µg | 11.4µg |
|
| Vitamin A | 594IU | 6IU |
|
| Vitamin A RAE | 139µg | 2µg |
|
| Vitamin E | 1.32mg |
|
|
| Vitamin C | 0.2mg | 0mg |
|
| Vitamin B1 | 0.184mg | 0.176mg |
|
| Vitamin B2 | 0.177mg | 0.18mg |
|
| Vitamin B3 | 1.365mg | 3.58mg |
|
| Vitamin B5 | 0.259mg |
|
|
| Vitamin B6 | 0.084mg | 0.128mg |
|
| Folate | 33µg | 16µg |
|
| Vitamin B12 | 0.08µg | 0µg |
|
| Vitamin K | 3.3µg |
|
|
| Tryptophan | 0.072mg |
|
|
| Threonine | 0.191mg |
|
|
| Isoleucine | 0.224mg |
|
|
| Leucine | 0.391mg |
|
|
| Lysine | 0.214mg |
|
|
| Methionine | 0.106mg |
|
|
| Phenylalanine | 0.27mg |
|
|
| Valine | 0.279mg |
|
|
| Histidine | 0.123mg |
|
|
| Cholesterol | 70mg | 1mg |
|
| Saturated Fat | 14.071g | 2.907g |
|
| Omega-3 - DHA | 0.003g | 0g |
|
| Monounsaturated Fat | 8.241g | 1.946g |
|
| Polyunsaturated fat | 4.541g | 1.258g |
|
Which food is preferable for your diet?
is better in case of low diet
|
|
|
| Low Fats diet |
|
|
| Low Carbs diet |
|
|
| Low Calories diet |
|
|
| Low Glycemic Index diet |
|
People also compare


Vitamins & Minerals Daily Need Coverage Score
The summary scores indicate the extent to which this food can fulfill your daily vitamin and mineral requirements if you consume 3 servings, consisting of 100 grams of each (an approximation of 3 serving sizes).
Vitamins Daily Need Coverage Score
18%
19%
Minerals Daily Need Coverage Score
55%
62%
Comparison summary
Which food is lower in Cholesterol?
Naan is lower in Cholesterol (difference - 69mg)
Which food is lower in Saturated Fat?
Naan is lower in Saturated Fat (difference - 11.164g)
Which food is richer in minerals?
Naan is relatively richer in minerals
Which food is lower in Sugar?
Chocolate chip cookie is lower in Sugar (difference - 3.4g)
Which food contains less Sodium?
Chocolate chip cookie contains less Sodium (difference - 126mg)
Which food is lower in glycemic index?
Chocolate chip cookie is lower in glycemic index (difference - 21)
Which food is cheaper?
?
The foods are relatively equal in price ($)
Which food is richer in vitamins?
?
It cannot be stated which food is richer in vitamins. See the charts below for detailed information. See the charts below for detailed information. See the charts below for detailed information.