Clementine full nutrition, GI, calories and weight loss effects

Summary
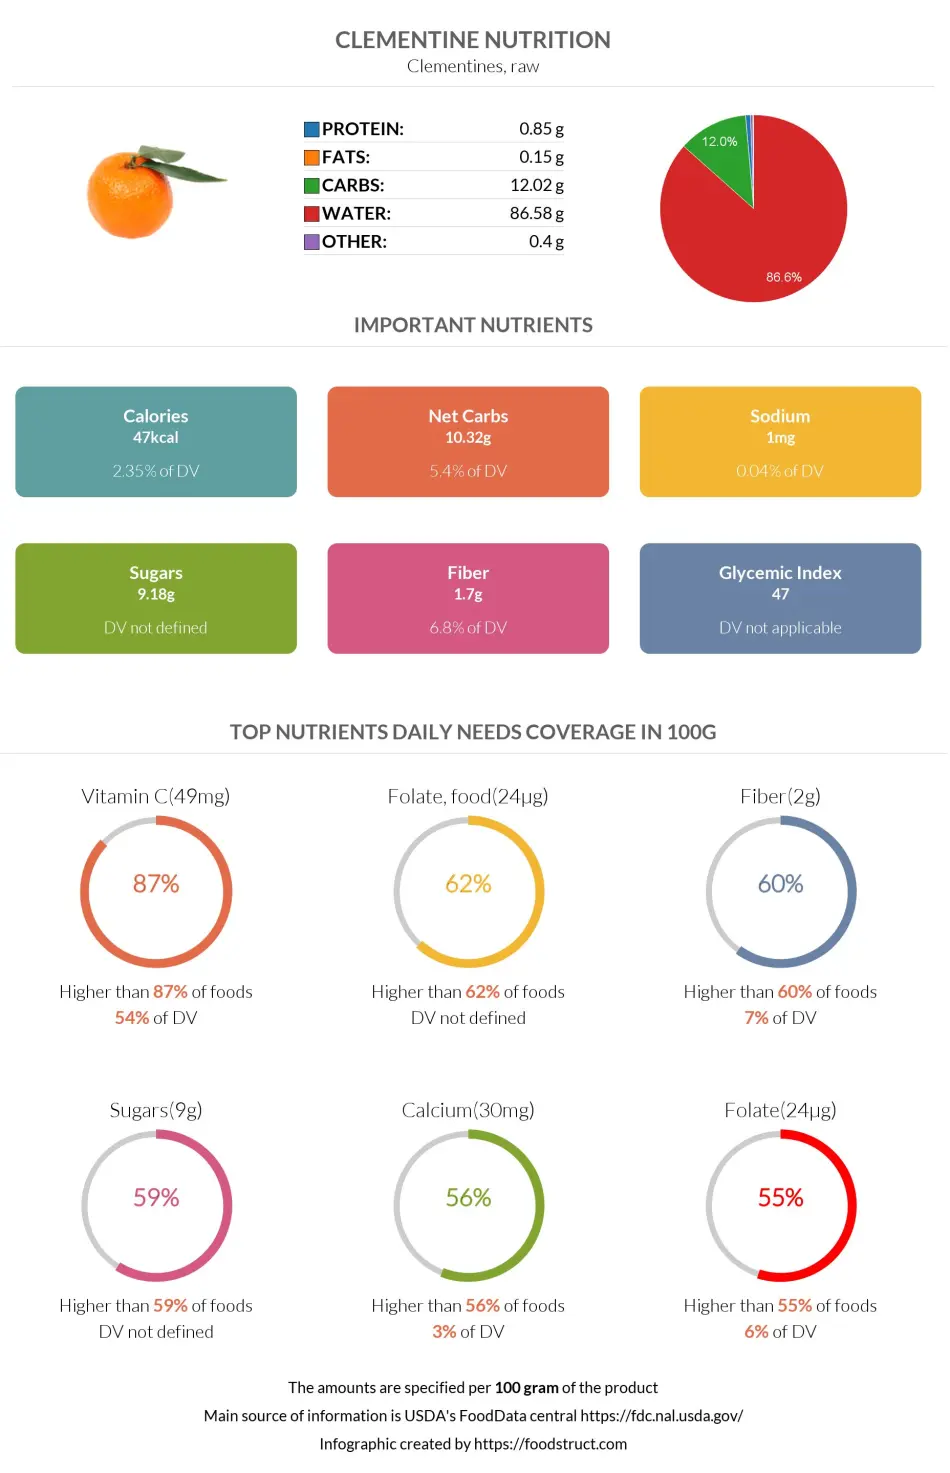
Clementines are foods rich in calcium, potassium, vitamin C, B1, B9. They have low fats and proteins and moderate carbohydrates and dietary fibers. They are low in calories and are categorized as low-glycemic index foods.
Clementine is also high in antioxidant phytochemicals, such as coumarins, limonoids, and flavonoids.
Table of contents
Introduction
Clementines are sweet citrus fruits that are a hybrid between mandarins and sweet oranges. They are seasonal fruits, available during mid-autumn and throughout winter.
In this article, we will discuss the nutritional values of clementines, their different subcategories, and their benefits during weight loss and different diets.
What is a clementine?
Clementine is a hybrid species between a mandarin and a sweet orange. The terms mandarin and clementine are often interchangeably used. Clementines and mandarin oranges have a similar carbohydrate composition, although clementines are slightly lower in carbohydrates.
Clementines have a bright orange coloring. They are smaller and sweeter than oranges. If you want more information, read our Clementine vs. Orange comparison article. Clementines have more comfortable benefits: they are seedless and easy to peel. Usually, clementine is consumed in a peeled, raw form, but it can also be used in dessert preparation.
Nutrition
Serving size
In this article, we are talking about the nutritional values of 100g serving of clementine. However, it is commonly served as a whole fruit that weighs 74g on average.
Macronutrients
Clementines are rich in water, given that about 84% of the clementine’s weight is water. As the chart below indicates, it is high in carbs as well. Clementines also contain some amounts of plant protein. More detailed information is provided in the corresponding sections below.
Macronutrients chart
Carbohydrates
There are 12g of carbohydrates in 100g of clementine distributed between 1.7g of dietary fibers and 10.3g of net carbs.
The amount of sugar makes up 18% of the daily recommended sugar value. Clementine is notably rich in sucrose, providing 6g per 100g. It also contains fructose and glucose.
Carbohydrate type breakdown
Fiber
The fiber content makes up 8% of the daily recommended value. Clementine provides both soluble and insoluble fiber.
Fiber content ratio for Clementine
Proteins
Clementines are not rich in proteins; they have 1g of protein, which makes up 2% of the daily recommended value. The protein content of clementines can be considered negligible.
Fat
The fat content of clementines can be considered negligible. In addition to that, clementines are non-animal products, so they do not contain cholesterol.
Vitamins
Clementines are citrus fruits famous for their rich Vitamin C content, which is a well-known powerful antioxidant. They contain 48.8mg of vitamin C. This is why clementine is included in the list of the top 13% foods with the highest Vitamin C content.
Clementines also have significant amounts of both vitamin B1 and vitamin B9 (folate).
Vitamin coverage chart
Vitamin chart - relative view
Minerals
Clementines do not have high amounts of minerals. However, they do contain significant amounts of calcium and potassium.
It contains 30mg of calcium, constituting only 2% of the recommended daily value. On the other hand, it contains 177mg of potassium, equalling only 4% of the recommended daily value.
Mineral coverage chart
Mineral chart - relative view
Calories
The consumption of 100 grams of clementines, equivalent to nearly one and a quarter clementines, is approximately 47 calories. Hence, clementine is considered a low-calorie food.
Glycemic index
An exact number for the glycemic index of clementines has not yet been researched. However, according to The International Tables of Glycemic Indices, mandarin segments, canned in juice, have a glycemic index of 47±2. This means mandarins and clementines have a low glycemic index (7).
Citrus, as a fruit with a low glycemic index, has been associated with improved blood glucose markers (8).
Another research concluded that citrus fruit intake is not correlated with the risk of type 2 diabetes (9).
In summary, clementines are a low glycemic index fruit and, in moderation, can be safely recommended to people with diabetic conditions or healthy individuals wary of their carbohydrate intake.
Phytochemicals
Coumarins
Clementine contains some amounts of coumarins, which are natural antioxidant compounds (10). They have a lot of therapeutic effects: antispasmodic, anti-inflammatory, antibacterial, etc. Coumarins are beneficial for skin conditions like vitiligo (11). Remember that furanocoumarins contained in citrus fruits may interact with some heart medications and cholesterol-lowering statins.
Naringin
Clementine also contains naringin flavonoid, although it has the lowest naringin contents among the other citrus fruits. Naringin is beneficial for the cardiovascular system: it has antihypertensive and antiatherosclerotic properties. Besides, naringin fights against obesity, hyperlipidemia, and liver steatosis (12).
Limonoids
Clementine includes nomilin content as well (13). It is a powerful glycoside from the limonoid family with antioxidant, antiviral, anticancer, and neuroprotective effects (14).
Weight loss and diets
Clementines are considered fruits recommended to be consumed in nearly most diets. It is low in calories and has a low glycemic index.
It is always a great choice to have a clementine in a healthy, balanced fruit bowl per day. It has 2g of dietary fiber, nearly 8% of the recommended daily value. In addition to that, it is full of water and vitamin C, which have essential antioxidant roles.
Clementines have different beneficial roles in the human body: (1)
- Anti-inflammatory
- Anti-carcinogenic
- Cardiovascular protective agents
- Neuroprotective factors
- Antioxidative characteristics
- Impact on reducing blood lipid levels
These are all due to coumarins (auraptene), flavonoids (naringenin), limonoids, carotenoids, and vitamin C.
Overall, clementine is a recommended fruit to be consumed in most diets. However, some diets have restrictions on them. In the following table, we will discuss the diets and restrictions.
Keto
Clementines have considerable amounts of total sugars and a glycemic index of 70.
However, it can be consumed in a keto diet in low amounts and is not recommended at all (2).
DASH
Clementines can be consumed without any restrictions in the DASH diet since fruits are recommended to be consumed (3).
Atkins
The Atkins diet focuses on removing or keeping carbohydrate consumption to a minimum. Low or no consumption of clementines is recommended (4).
Mediterranean
Clementines are highly recommended to be consumed in this diet because clementines are rich in vitamin C, which has antioxidant characteristics (5).
Paleo diet
Clementines can be consumed in the paleo diet (6).
Vegan/ Vegetarian/ Pescatarian
Clementines can be consumed without restriction in these diets since clementine is a fruit.
Dukan
Dukan diets exclude fruits; thus, clementines cannot be consumed.
Intermittent fasting
Intermittent fasting has no restrictions on the types of food that we can consume. However, it focuses on the duration of when to consume these foods. Clementines can be consumed during eating intervals.
Low-fat/Low-calorie
Clementines fall under both categories. They have negligible amounts of fat. In addition to that, they have 47 calories, which is only 2% of the daily value.
Low Carb
Clementines do not have high amounts of carbohydrates. However, the amount present is considerable and significant. Consumption in moderation is recommended.
BRAT
Clementines are not recommended because they are acidic foods, which cause upsetting of the stomach during gastrointestinal problems.
Anti-Inflammatory
Clementines are highly anti-inflammatory and have antioxidant qualities. This is due to the vitamin C content of clementines. Clementines can be consumed and are recommended in this diet.
References
- https://www.ncbi.nlm.nih.gov/pmc/articles/PMC4690266/
- https://www.ncbi.nlm.nih.gov/books/NBK499830/
- https://www.ncbi.nlm.nih.gov/books/NBK482514/
- https://www.ncbi.nlm.nih.gov/books/NBK537084/
- https://www.ncbi.nlm.nih.gov/pmc/articles/PMC7278874/
- https://www.ncbi.nlm.nih.gov/books/NBK482457/
- https://care.diabetesjournals.org/content/diacare/suppl/2008/09/18/dc08-1239.DC1/TableA1_1.pdf
- https://www.ncbi.nlm.nih.gov/pmc/articles/PMC3017317/
- https://www.primary-care-diabetes.com/article/S1751-9918(15)00182-5/fulltext
- https://www.ncbi.nlm.nih.gov/pmc/articles/PMC7278589/
- https://www.ncbi.nlm.nih.gov/pmc/articles/PMC8440074/
- https://www.ncbi.nlm.nih.gov/pmc/articles/PMC4085189/
- https://www.ncbi.nlm.nih.gov/pmc/articles/PMC7278874/
- https://www.ncbi.nlm.nih.gov/pmc/articles/PMC9822165/#:~:text=A%20number%20of%20studies%20have,%2C%20and%20neuro%2Dprotective%20effects.

Important nutritional characteristics for Clementine
| Glycemic index ⓘ Gi values are taken from various scientific sources. GI values less than 55 are considered as low. Values above 70 are considered as high. | 47 (low) |
| Glycemic load | 4 (low) |
| Calories ⓘ Calories per 100-gram serving | 47 |
| Net Carbs ⓘ Net Carbs = Total Carbohydrates – Fiber – Sugar Alcohols | 10.32 grams |
| Serving Size ⓘ Serving sizes are taken from FDA's Reference Amounts Customarily Consumed (RACCs) | 1 fruit (74 grams) |
| Acidity (Based on PRAL) ⓘ PRAL (Potential renal acid load) is calculated using a formula. On the PRAL scale the higher the positive value, the more is the acidifying effect on the body. The lower the negative value, the higher the alkalinity of the food. 0 is neutral. | -3.2 (alkaline) |
Clementine calories (kcal)
| Serving Size | Calories | Weight |
|---|---|---|
| Calories in 100 grams | 47 | |
| Calories in 1 fruit | 35 | 74 g |
Clementine Glycemic index (GI)
Clementine Glycemic load (GL)
All nutrients for Clementine per 100g
| Nutrient | Value | DV% | In TOP % of foods | Comparison |
| Calories | 47kcal | 2% | 88% |
Equal to Orange
|
| Protein | 0.85g | 2% | 86% |
3.3 times less than Broccoli
|
| Fats | 0.15g | 0% | 90% |
222.1 times less than Cheddar Cheese
|
| Vitamin C | 48.8mg | 54% | 13% |
1.1 times less than Lemon
|
| Net carbs | 10.32g | N/A | 45% |
5.2 times less than Chocolate
|
| Carbs | 12.02g | 4% | 45% |
2.3 times less than Rice
|
| Vitamin D | 0µg | 0% | 100% |
N/A
|
| Iron | 0.14mg | 2% | 91% |
18.6 times less than Beef broiled
|
| Calcium | 30mg | 3% | 44% |
4.2 times less than Milk
|
| Potassium | 177mg | 5% | 65% |
1.2 times more than Cucumber
|
| Magnesium | 10mg | 2% | 84% |
14 times less than Almond
|
| Sugar | 9.18g | N/A | 41% |
Equal to Coca-Cola
|
| Fiber | 1.7g | 7% | 40% |
1.4 times less than Orange
|
| Copper | 0.04mg | 5% | 83% |
3.3 times less than Shiitake
|
| Zinc | 0.06mg | 1% | 94% |
105.2 times less than Beef broiled
|
| Starch | 0g | 0% | 100% |
N/A
|
| Phosphorus | 21mg | 3% | 88% |
8.7 times less than Chicken meat
|
| Sodium | 1mg | 0% | 98% |
490 times less than White Bread
|
| Vitamin E | 0.2mg | 1% | 76% |
7.3 times less than Kiwifruit
|
| Selenium | 0.1µg | 0% | 96% | |
| Manganese | 0.02mg | 1% | 74% | |
| Vitamin B1 | 0.09mg | 7% | 53% |
3.1 times less than Pea raw
|
| Vitamin B2 | 0.03mg | 2% | 87% |
4.3 times less than Avocado
|
| Vitamin B3 | 0.64mg | 4% | 75% |
15.1 times less than Turkey meat
|
| Vitamin B5 | 0.15mg | 3% | 85% |
7.5 times less than Sunflower seed
|
| Vitamin B6 | 0.08mg | 6% | 71% |
1.6 times less than Oat
|
| Vitamin K | 0µg | 0% | 100% |
N/A
|
| Folate | 24µg | 6% | 45% |
2.5 times less than Brussels sprout
|
| Trans Fat | 0g | N/A | 100% |
N/A
|
| Fructose | 1.64g | 2% | 84% |
3.6 times less than Apple
|
Check out similar food or compare with current
NUTRITION FACTS LABEL
Serving Size ______________
Health checks
Clementine nutrition infographic
References
All the values for which the sources are not specified explicitly are taken from FDA’s Food Central. The exact link to the food presented on this page can be found below.