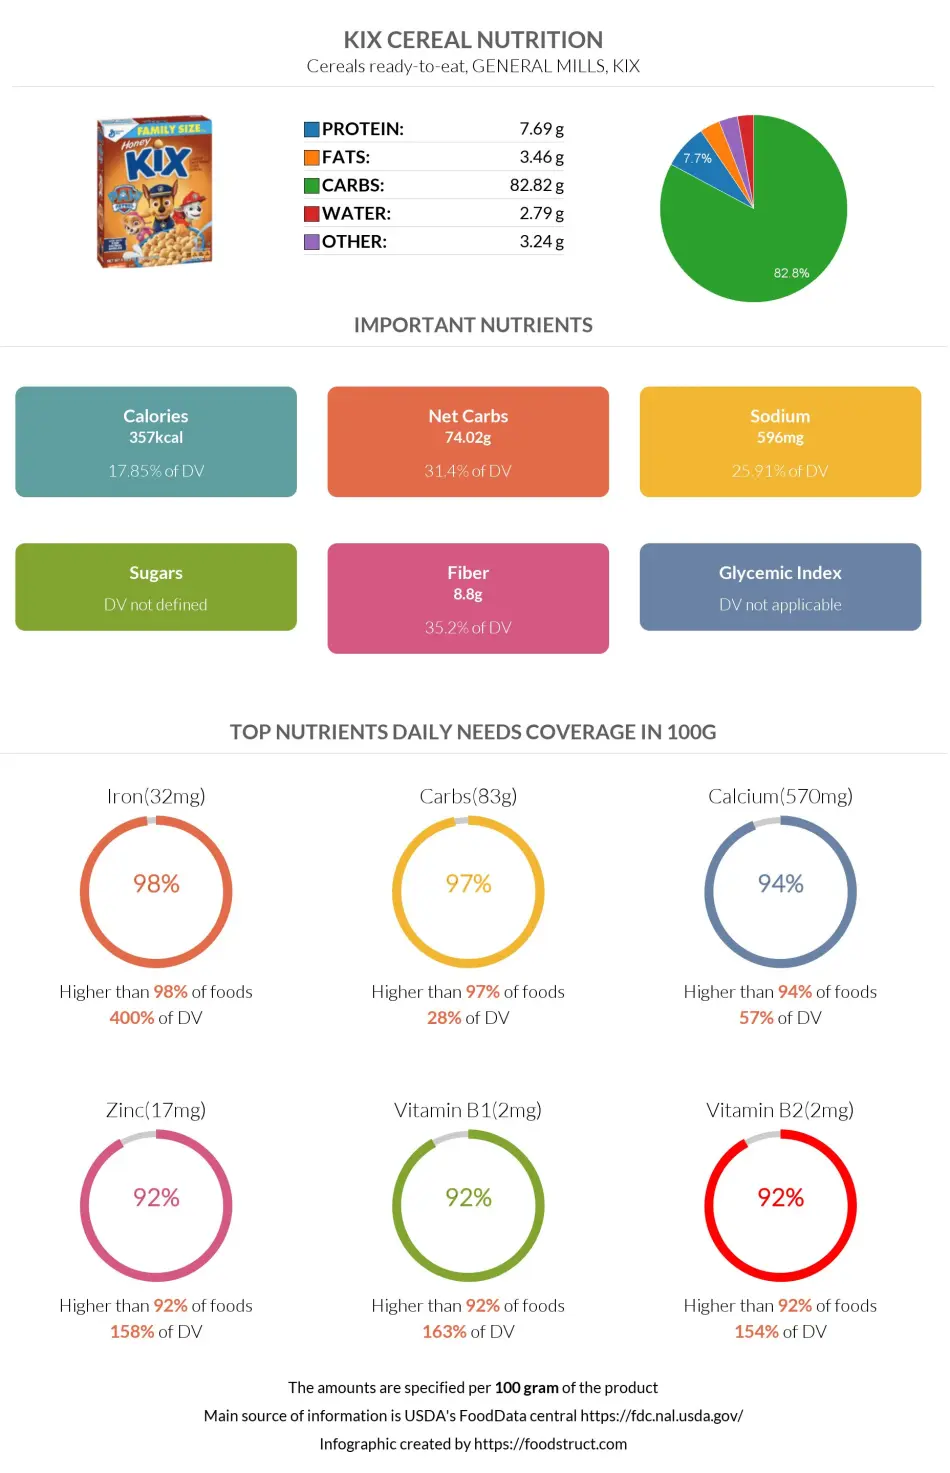
Kix Cereal nutrition: calories, carbs, GI, protein, fiber, fats
Cereals ready-to-eat, GENERAL MILLS, KIX
*all the values are displayed for the amount of 100 grams
Important nutritional characteristics for Kix Cereal

| Calories ⓘ Calories per 100-gram serving | 357 |
| Net Carbs ⓘ Net Carbs = Total Carbohydrates – Fiber – Sugar Alcohols | 74.02 grams |
| Serving Size ⓘ Serving sizes are taken from FDA's Reference Amounts Customarily Consumed (RACCs) | 1.25 cup (1 NLEA serving) (30 grams) |
| Acidity (Based on PRAL) ⓘ PRAL (Potential renal acid load) is calculated using a formula. On the PRAL scale the higher the positive value, the more is the acidifying effect on the body. The lower the negative value, the higher the alkalinity of the food. 0 is neutral. | -2.7 (alkaline) |
Iron ⓘHigher in Iron content than 98% of foods
Carbs ⓘHigher in Carbs content than 97% of foods
Net carbs ⓘHigher in Net carbs content than 95% of foods
Calcium ⓘHigher in Calcium content than 94% of foods
Zinc ⓘHigher in Zinc content than 92% of foods
Kix Cereal calories (kcal)
| Serving Size | Calories | Weight |
|---|---|---|
| Calories in 100 grams | 357 |
Mineral coverage chart
Calcium:
570 mg of 1,000 mg
57%
Iron:
32 mg of 8 mg
400%
Magnesium:
51 mg of 420 mg
12%
Phosphorus:
189 mg of 700 mg
27%
Potassium:
223 mg of 3,400 mg
7%
Sodium:
596 mg of 2,300 mg
26%
Zinc:
17.42 mg of 11 mg
158%
Copper:
0.142 mg of 1 mg
16%
Manganese:
1.13 mg of 2 mg
49%
Selenium:
8.5 µg of 55 µg
15%
Choline:
15.3 mg of 550 mg
3%
Mineral chart - relative view
Iron
32 mg
TOP 2%
Calcium
570 mg
TOP 6%
Zinc
17.42 mg
TOP 8%
Sodium
596 mg
TOP 16%
Magnesium
51 mg
TOP 22%
Manganese
1.13 mg
TOP 31%
Copper
0.142 mg
TOP 39%
Phosphorus
189 mg
TOP 41%
Potassium
223 mg
TOP 54%
Selenium
8.5 µg
TOP 62%
Choline
15.3 mg
TOP 80%
Vitamin coverage chart
Vitamin A:
3078 IU of 5,000 IU
62%
Vitamin E :
0.3 mg of 15 mg
2%
Vitamin D:
3.3 µg of 10 µg
33%
Vitamin C:
25.4 mg of 90 mg
28%
Vitamin B1:
1.955 mg of 1 mg
163%
Vitamin B2:
2 mg of 1 mg
154%
Vitamin B3:
24.25 mg of 16 mg
152%
Vitamin B5:
0.522 mg of 5 mg
10%
Vitamin B6:
2.3 mg of 1 mg
177%
Folate:
787 µg of 400 µg
197%
Vitamin B12:
5.7 µg of 2 µg
238%
Vitamin K:
0.2 µg of 120 µg
0%
Vitamin chart - relative view
Vitamin B3
24.25 mg
TOP 8%
Vitamin B1
1.955 mg
TOP 8%
Vitamin B2
2 mg
TOP 8%
Vitamin B6
2.3 mg
TOP 11%
Vitamin A
3078 IU
TOP 12%
Folate
787 µg
TOP 15%
Vitamin B12
5.7 µg
TOP 17%
Vitamin C
25.4 mg
TOP 17%
Vitamin D
3.3 µg
TOP 40%
Vitamin B5
0.522 mg
TOP 57%
Vitamin E
0.3 mg
TOP 67%
Vitamin K
0.2 µg
TOP 85%
Macronutrients chart
Protein:
Daily Value: 15%
7.69 g of 50 g
15%
Fats:
Daily Value: 5%
3.46 g of 65 g
5%
Carbs:
Daily Value: 28%
82.82 g of 300 g
28%
Water:
Daily Value: 0%
2.79 g of 2,000 g
0%
Other:
3.24 g
Protein quality breakdown
Tryptophan:
62 mg of 280 mg
22%
Threonine:
279 mg of 1,050 mg
27%
Isoleucine:
258 mg of 1,400 mg
18%
Leucine:
971 mg of 2,730 mg
36%
Lysine:
176 mg of 2,100 mg
8%
Methionine:
134 mg of 1,050 mg
13%
Phenylalanine:
413 mg of 1,750 mg
24%
Valine:
331 mg of 1,820 mg
18%
Histidine:
186 mg of 700 mg
27%
Fat type information
Saturated Fat:
0.576 g
Monounsaturated Fat:
0.99 g
Polyunsaturated fat:
1.277 g
Carbohydrate type breakdown
Starch:
58.47 g
Sucrose:
8.93 g
Glucose:
0.57 g
Fructose:
0.11 g
Lactose:
0 g
Maltose:
0.15 g
Galactose:
0 g
Fiber content ratio for Kix Cereal
Sugar:
9.76 g
Fiber:
8.8 g
Other:
64.26 g
All nutrients for Kix Cereal per 100g
| Nutrient | Value | DV% | In TOP % of foods | Comparison |
| Calories | 357kcal | 18% | 22% |
7.6 times more than Orange
|
| Protein | 7.69g | 18% | 51% |
2.7 times more than Broccoli
|
| Fats | 3.46g | 5% | 59% |
9.6 times less than Cheddar Cheese
|
| Vitamin C | 25.4mg | 28% | 17% |
2.1 times less than Lemon
|
| Net carbs | 74.02g | N/A | 5% |
1.4 times more than Chocolate
|
| Carbs | 82.82g | 28% | 3% |
2.9 times more than Rice
|
| Cholesterol | 0mg | 0% | 100% |
N/A
|
| Vitamin D | 3.3µg | 33% | 40% |
1.5 times more than Egg
|
| Iron | 32mg | 400% | 2% |
12.3 times more than Beef broiled
|
| Calcium | 570mg | 57% | 6% |
4.6 times more than Milk
|
| Potassium | 223mg | 7% | 54% |
1.5 times more than Cucumber
|
| Magnesium | 51mg | 12% | 22% |
2.7 times less than Almond
|
| Sugar | 9.76g | N/A | 40% |
1.1 times more than Coca-Cola
|
| Fiber | 8.8g | 35% | 12% |
3.7 times more than Orange
|
| Copper | 0.14mg | 16% | 39% |
Equal to Shiitake
|
| Zinc | 17.42mg | 158% | 8% |
2.8 times more than Beef broiled
|
| Starch | 58.47g | 24% | 87% |
3.8 times more than Potato
|
| Phosphorus | 189mg | 27% | 41% |
Equal to Chicken meat
|
| Sodium | 596mg | 26% | 16% |
1.2 times more than White Bread
|
| Vitamin A | 3078IU | 62% | 12% |
5.4 times less than Carrot
|
| Vitamin A RAE | 879µg | 98% | 19% | |
| Vitamin E | 0.3mg | 2% | 67% |
4.9 times less than Kiwifruit
|
| Selenium | 8.5µg | 15% | 62% | |
| Manganese | 1.13mg | 49% | 31% | |
| Vitamin B1 | 1.96mg | 163% | 8% |
7.3 times more than Pea raw
|
| Vitamin B2 | 2mg | 154% | 8% |
15.4 times more than Avocado
|
| Vitamin B3 | 24.25mg | 152% | 8% |
2.5 times more than Turkey meat
|
| Vitamin B5 | 0.52mg | 10% | 57% |
2.2 times less than Sunflower seed
|
| Vitamin B6 | 2.3mg | 177% | 11% |
19.3 times more than Oat
|
| Vitamin B12 | 5.7µg | 238% | 17% |
8.1 times more than Pork
|
| Vitamin K | 0.2µg | 0% | 85% |
508 times less than Broccoli
|
| Folate | 787µg | 197% | 15% |
12.9 times more than Brussels sprout
|
| Trans Fat | 0.03g | N/A | 69% |
595.6 times less than Margarine
|
| Saturated Fat | 0.58g | 3% | 68% |
10.2 times less than Beef broiled
|
| Monounsaturated Fat | 0.99g | N/A | 65% |
9.9 times less than Avocado
|
| Polyunsaturated fat | 1.28g | N/A | 40% |
36.9 times less than Walnut
|
| Tryptophan | 0.06mg | 0% | 84% |
4.9 times less than Chicken meat
|
| Threonine | 0.28mg | 0% | 79% |
2.6 times less than Beef broiled
|
| Isoleucine | 0.26mg | 0% | 82% |
3.5 times less than Salmon raw
|
| Leucine | 0.97mg | 0% | 74% |
2.5 times less than Tuna Bluefin
|
| Lysine | 0.18mg | 0% | 87% |
2.6 times less than Tofu
|
| Methionine | 0.13mg | 0% | 80% |
1.4 times more than Quinoa
|
| Phenylalanine | 0.41mg | 0% | 78% |
1.6 times less than Egg
|
| Valine | 0.33mg | 0% | 82% |
6.1 times less than Soybean raw
|
| Histidine | 0.19mg | 0% | 80% |
4 times less than Turkey meat
|
| Fructose | 0.11g | 0% | 92% |
53.6 times less than Apple
|
| Omega-3 - EPA | 0.02g | N/A | 37% |
43.1 times less than Salmon
|
| Omega-3 - DHA | 0g | N/A | 100% |
N/A
|
| Omega-3 - ALA | 0.04g | N/A | 90% |
228.5 times less than Canola oil
|
| Omega-3 - DPA | 0.01g | N/A | 49% |
34 times less than Salmon
|
| Omega-3 - Eicosatrienoic acid | 0g | N/A | 100% | |
| Omega-6 - Gamma-linoleic acid | 0g | N/A | 100% | |
| Omega-6 - Dihomo-gamma-linoleic acid | 0g | N/A | 100% | |
| Omega-6 - Eicosadienoic acid | 0g | N/A | 100% | |
| Omega-6 - Linoleic acid | 1.21g | N/A | 86% |
10.2 times less than Almond
|
Check out similar food or compare with current
NUTRITION FACTS LABEL
Nutrition Facts
___servings per container
Serving Size ______________
Serving Size ______________
Amount Per 100g
Calories 357
% Daily Value*
5%
Total Fat
3g
5%
Saturated Fat 1g
0%
Cholesterol 0mg
26%
Sodium 596mg
28%
Total Carbohydrate
83g
36%
Dietary Fiber
9g
Total Sugars g
Includes ? g Added Sugars
Protein
8g
Vitamin D
133mcg
22%
Calcium
570mg
57%
Iron
32mg
400%
Potassium
223mg
7%
*
The % Daily Value (DV) tells you how much a nutrient in a serving of food contributes to a daily diet. 2,000 calories a day is used for general nutrition advice.
Health checks
Low in Cholesterol
ⓘ
Dietary cholesterol is not associated with an increased risk of coronary heart disease in healthy individuals. However, dietary cholesterol is common in foods that are high in harmful saturated fats.
Source
No Trans Fats
ⓘ
Trans fat consumption increases the risk of cardiovascular disease and mortality by negatively affecting blood lipid levels.
Source
Low in Saturated Fats
ⓘ
Saturated fat intake can raise total cholesterol and LDL (low-density lipoprotein) levels, leading to an increased risk of atherosclerosis. Dietary guidelines recommend limiting saturated fats to under 10% of calories a day.
Source
Low in Sugars
ⓘ
While the consumption of moderate amounts of added sugars is not detrimental to health, an excessive intake can increase the risk of obesity, and therefore, diabetes.
Source
Kix Cereal nutrition infographic
Infographic link