Mulberries Nutrition, Glycemic Index, and Calories

Introduction
Mulberry is a fruit composed of a cluster of drupelets. Its white, black, and red varieties are all delicious fruits consumed worldwide. In this article, we will be exploring the nutritional composition of mulberries as well as their phytochemicals, glycemic index, and more.
Table of contents
Varieties
Mulberries are the fruits of the Mulberry tree. It is closely related to figs. The leaves of this tree are the only feed for silkworms and are widely used in North America and Asia.
Different varieties of mulberry fruits are used as a snack or an ingredient of tea, jam, wine, etc. There are three famous Mulberry varieties: Morus alba - white mulberry, native to Asia; Morus rubra - red Mulberry that comes from North America; and Morus nigra - black Mulberry that is popular in South Caucasus, Turkey, and Persia.
Nutrition
Mulberries can have different nutritional values depending on the species. Based on that, the taste may change anywhere from tart to sweet.
One average serving of mulberries is about one cup or 140 grams.
Macronutrients and Calories
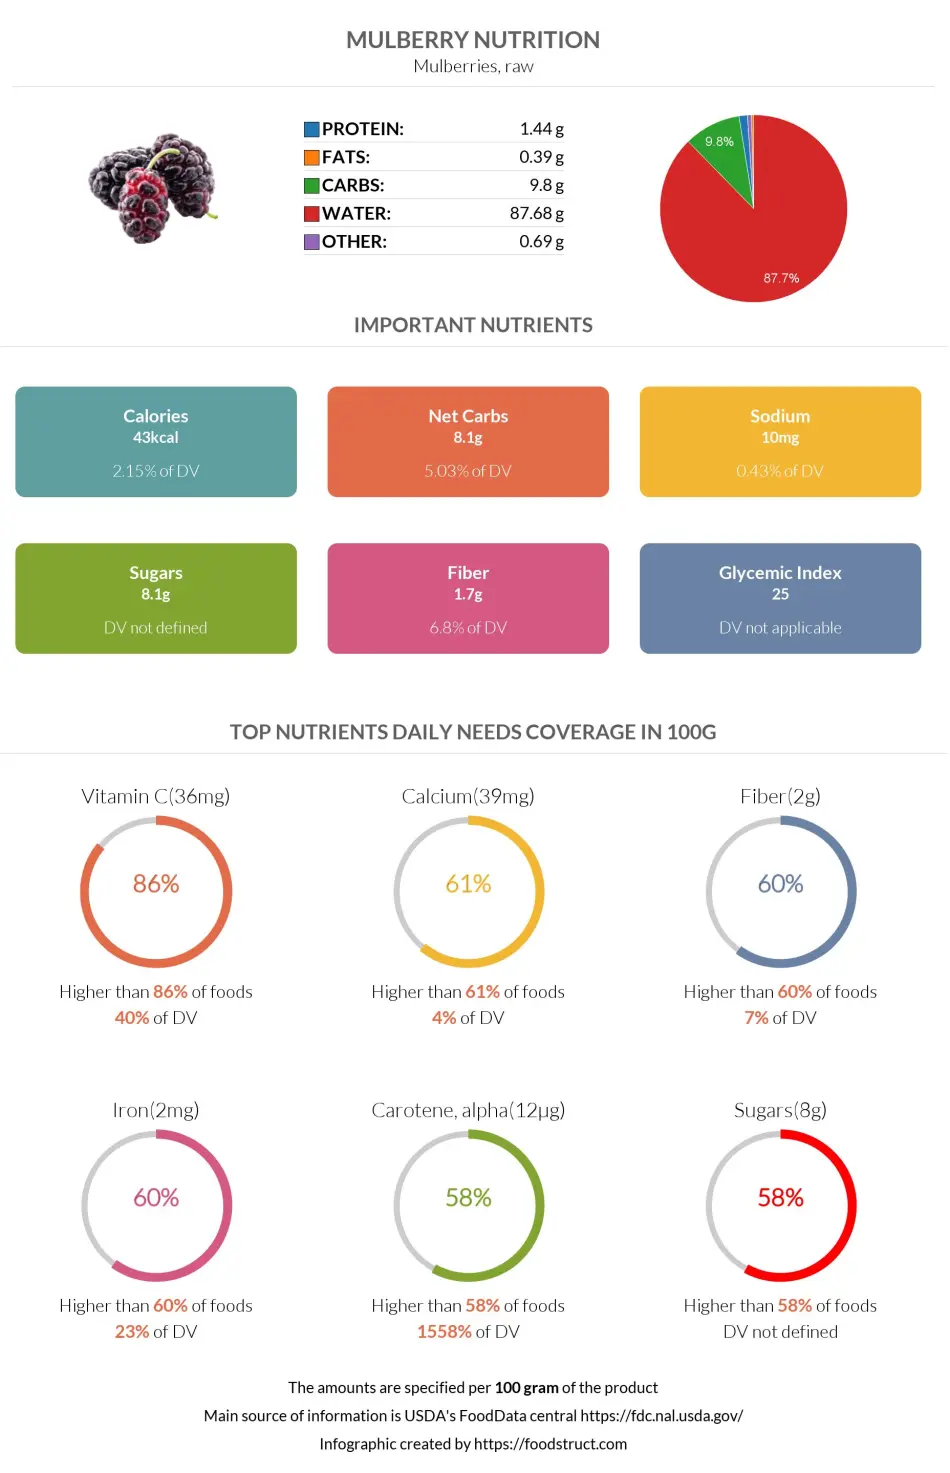
Mulberries consist of 88% water and 10% carbs.
Macronutrients chart
Calories
A 100g of mulberries contains only 43 calories. One serving (140 grams) of mulberries contains 60 calories.
Mulberry is considered to be a low-calorie food.
Carbohydrates
One cup of mulberries contains 14g of total carbohydrates. Of those carbohydrates, 83% are sugars, and 17% are dietary fiber.
Hence, mulberries are low-sugar fruits.
Protein
A one-cup serving of mulberries contains 2g of proteins, whereas a 100-gram serving provides only 1.44 grams.
Fats
One serving of mulberries contains less than one gram of fat. The predominant fats are polyunsaturated fatty acids, followed by monounsaturated and saturated fatty acids.
As a fruit, mulberry naturally contains no cholesterol and no trans fats.
Fat type information
Vitamins
Mulberries are a great source of vitamin C. Per 100-gram serving, they contain 36.4mg of vitamin C. Vitamin C content in mulberries is only 1.5 times less than that of lemons.
They also contain moderate amounts of vitamin E, vitamin K, vitamin A, and vitamin B2.
These fruits are low in vitamin B3, folate or vitamin B9, vitamins B6 and B1.
Mulberries completely lack vitamin D and vitamin B12.
Vitamin coverage chart
Minerals
Mulberries are rich in iron and calcium. Each 100-gram serving contains 1.85mg of iron and 39mg of calcium. Mulberries also contain moderate to low levels of potassium, magnesium, copper, phosphorus, choline, selenium, and zinc,
Mulberries are low in sodium.
Mineral coverage chart
Glycemic Index
The glycemic index of mulberry is 25, which puts it in the low category.
Black mulberries and white mulberry leaves have been studied to have antidiabetic and glycemic index-reducing qualities (3, 4).
Acidity
The acidity of mulberries greatly differs depending on the species. On average, the pH of mulberry fruits can fall between 4.47 and 6.79, even though some genotypes may have a pH as low as 2.29 (5).
The acidity of mulberries based on potential renal acid load (PRAL) has been calculated to be -2.9, making it alkaline. PRAL demonstrates the capacity of base or acid production of the food.
Phytochemicals
One article explores the fact that alkaloids and polyphenols are the prominent phytochemicals found in mulberries, all linked to beneficial effects on health (2).
Another article lists the same phytochemicals and dives deeper into their compositions (6). The authors list alkaloid compounds (such as quinine), α-glucosidase inhibitors, and polyphenols (anthocyanins, phenolic acids) as the predominant phytochemicals identified in mulberries.
Mulberries are an especially important source of anthocyanins since they are the predominant active ingredient identified in the fruit (6). The authors also state that cyanidin-3-glucoside (C3G) and cyanidin-3-rutinoside (C3R) are the main anthocyanins found in mulberries, whereas hydroxycinnamic acid derivatives are the primary phenolic acids.
Nutritional Comparison Among Mulberry Varieties
Even though mulberry has dozens of cultivars, there are three widely known prominent varieties: white (Morus alba), black (Morus nigra), and red (Morus rubra) mulberry (10). The red mulberry is also known as the American mulberry, as it is native to eastern areas of the United States. Although all of these mulberries are full of healthy nutrients, we can still consider some variations.
Differences in Vitamins and Minerals
One research indicates that although all mulberries are excellent sources of vitamin C, black mulberries contain the highest levels of vitamin C compared to other varieties (10).
The authors also list many other nutritional differences in their work. For example, white mulberries contain slightly higher calcium and potassium levels than black and red varieties. On the other hand, black varieties provide slightly more fiber than white varieties.
Differences in Acidity
Some studies mention that black mulberries have a lower pH value than white mulberries. This, in turn, makes black mulberries taste sweeter (8, 9, 10).
Differences in Phytochemicals
Anthocyanins
Research indicates white mulberries do not contain anthocyanins (6, 8). Moreover, the amount of anthocyanins in other varieties may vary depending on climate, soil, and many more factors.
Phenolic Acids
The phenolic acid composition in mulberries also varies depending on the type. For example, the dominant phenolic acid found in black mulberry is chlorogenic acid, whereas it is ruined in white and red mulberry (6). The research authors also noticed that chlorogenic acid was higher in black varieties than in white ones.
One study found that compared to white mulberries, black mulberries provided higher antioxidant activity and contained more phenolic compounds (7, 9, 10).
Comparison to Similar Foods
Black mulberries are often confused with blackberries, even though they are unrelated. Compared to blackberries, mulberries contain more vitamin C and iron. On the other hand, blackberries are richer in vitamin K, copper, and manganese. Read more about the nutritional differences between blackberries and blueberries in our article.
Regarding strawberries, mulberries are richer in iron, whereas strawberries are richer in vitamin C and contain fewer sugars. Read more on our Mulberry vs. Strawberry page.
Mulberries are again richer in vitamin C and iron than cranberries. However, cranberries provide more fiber and manganese and are lower in sugar. Refer to our Mulberry vs. Cranberry page for more details.
References
- https://www.crfg.org/pubs/ff/mulberry.html
- https://pubmed.ncbi.nlm.nih.gov/19761189/
- m.nih.gov/pmc/articles/PMC6113008/
- https://pubmed.ncbi.nlm.nih.gov/30632080/
- https://www.researchgate.net/publication/330914405
- https://www.ncbi.nlm.nih.gov/pmc/articles/PMC9028580/
- https://www.sciencedirect.com/science/article/pii/S1756464614003892
- https://www.mdpi.com/2223-7747/11/2/152
- https://www.jnsciences.org/agri-biotech/51-volume-35/268
- https://www.ncbi.nlm.nih.gov/pmc/articles/PMC8241616/

Important nutritional characteristics for Mulberry
| Glycemic index ⓘ Gi values are taken from various scientific sources. GI values less than 55 are considered as low. Values above 70 are considered as high. | 25 (low) |
| Glycemic load | 3 (low) |
| Calories ⓘ Calories per 100-gram serving | 43 |
| Net Carbs ⓘ Net Carbs = Total Carbohydrates – Fiber – Sugar Alcohols | 8.1 grams |
| Serving Size ⓘ Serving sizes are taken from FDA's Reference Amounts Customarily Consumed (RACCs) | 1 cup (140 grams) |
| Acidity (Based on PRAL) ⓘ PRAL (Potential renal acid load) is calculated using a formula. On the PRAL scale the higher the positive value, the more is the acidifying effect on the body. The lower the negative value, the higher the alkalinity of the food. 0 is neutral. | -2.9 (alkaline) |
Mulberry calories (kcal)
| Serving Size | Calories | Weight |
|---|---|---|
| Calories in 100 grams | 43 | |
| Calories in 1 cup | 60 | 140 g |
| Calories in 10 fruit | 6 | 15 g |
Mulberry Glycemic index (GI)
Mulberry Glycemic load (GL)
Mineral chart - relative view
Vitamin chart - relative view
Fiber content ratio for Mulberry
All nutrients for Mulberry per 100g
| Nutrient | Value | DV% | In TOP % of foods | Comparison |
| Calories | 43kcal | 2% | 90% |
1.1 times less than Orange
|
| Protein | 1.44g | 3% | 82% |
2 times less than Broccoli
|
| Fats | 0.39g | 1% | 83% |
85.4 times less than Cheddar Cheese
|
| Vitamin C | 36.4mg | 40% | 14% |
1.5 times less than Lemon
|
| Net carbs | 8.1g | N/A | 49% |
6.7 times less than Chocolate
|
| Carbs | 9.8g | 3% | 49% |
2.9 times less than Rice
|
| Cholesterol | 0mg | 0% | 100% |
N/A
|
| Vitamin D | 0µg | 0% | 100% |
N/A
|
| Iron | 1.85mg | 23% | 40% |
1.4 times less than Beef broiled
|
| Calcium | 39mg | 4% | 38% |
3.2 times less than Milk
|
| Potassium | 194mg | 6% | 60% |
1.3 times more than Cucumber
|
| Magnesium | 18mg | 4% | 66% |
7.8 times less than Almond
|
| Sugar | 8.1g | N/A | 42% |
1.1 times less than Coca-Cola
|
| Fiber | 1.7g | 7% | 40% |
1.4 times less than Orange
|
| Copper | 0.06mg | 7% | 75% |
2.4 times less than Shiitake
|
| Zinc | 0.12mg | 1% | 89% |
52.6 times less than Beef broiled
|
| Phosphorus | 38mg | 5% | 81% |
4.8 times less than Chicken meat
|
| Sodium | 10mg | 0% | 85% |
49 times less than White Bread
|
| Vitamin A | 25IU | 1% | 57% |
668.2 times less than Carrot
|
| Vitamin A RAE | 1µg | 0% | 72% | |
| Vitamin E | 0.87mg | 6% | 49% |
1.7 times less than Kiwifruit
|
| Selenium | 0.6µg | 1% | 88% | |
| Vitamin B1 | 0.03mg | 2% | 83% |
9.2 times less than Pea raw
|
| Vitamin B2 | 0.1mg | 8% | 68% |
1.3 times less than Avocado
|
| Vitamin B3 | 0.62mg | 4% | 75% |
15.4 times less than Turkey meat
|
| Vitamin B6 | 0.05mg | 4% | 79% |
2.4 times less than Oat
|
| Vitamin B12 | 0µg | 0% | 100% |
N/A
|
| Vitamin K | 7.8µg | 7% | 52% |
13 times less than Broccoli
|
| Folate | 6µg | 2% | 76% |
10.2 times less than Brussels sprout
|
| Trans Fat | 0g | N/A | 100% |
N/A
|
| Saturated Fat | 0.03g | 0% | 89% |
218.3 times less than Beef broiled
|
| Monounsaturated Fat | 0.04g | N/A | 85% |
239 times less than Avocado
|
| Polyunsaturated fat | 0.21g | N/A | 78% |
227.9 times less than Walnut
|
| Omega-3 - EPA | 0g | N/A | 100% |
N/A
|
| Omega-3 - DHA | 0g | N/A | 100% |
N/A
|
| Omega-3 - DPA | 0g | N/A | 100% |
N/A
|
Check out similar food or compare with current

NUTRITION FACTS LABEL
Serving Size ______________
Health checks
Mulberry nutrition infographic
References
All the values for which the sources are not specified explicitly are taken from FDA’s Food Central. The exact link to the food presented on this page can be found below.