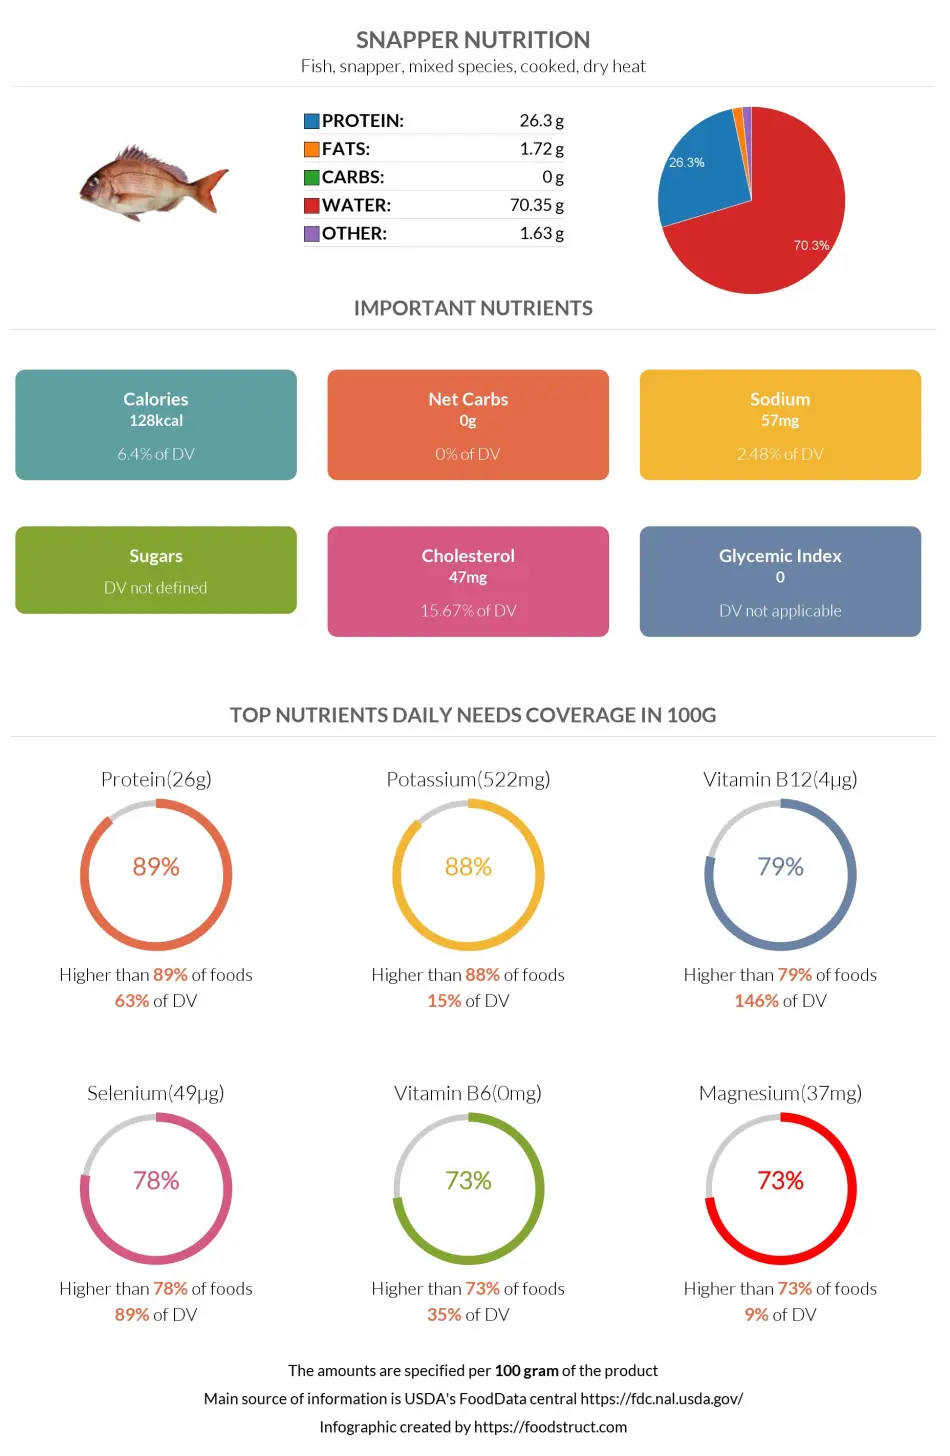
Snapper nutrition: calories, carbs, GI, protein, fiber, fats
Fish, snapper, mixed species, cooked, dry heat
*all the values are displayed for the amount of 100 grams
Important nutritional characteristics for Snapper

|
Glycemic index ⓘ
Source: *Explanation
Check out our Glycemic index chart page for the full list.
|
0 (low) |
| Calories ⓘ Calories per 100-gram serving | 128 |
| Net Carbs ⓘ Net Carbs = Total Carbohydrates – Fiber – Sugar Alcohols | 0 grams |
| Serving Size ⓘ Serving sizes are taken from FDA's Reference Amounts Customarily Consumed (RACCs) | 1 fillet (170 grams) |
| Acidity (Based on PRAL) ⓘ PRAL (Potential renal acid load) is calculated using a formula. On the PRAL scale the higher the positive value, the more is the acidifying effect on the body. The lower the negative value, the higher the alkalinity of the food. 0 is neutral. | 7.9 (acidic) |
| Oxalates ⓘ Animal products do not contain oxalate. | 0mg |
Protein ⓘHigher in Protein content than 89% of foods
Potassium ⓘHigher in Potassium content than 88% of foods
Vitamin B12 ⓘHigher in Vitamin B12 content than 79% of foods
Selenium ⓘHigher in Selenium content than 78% of foods
Vitamin B6 ⓘHigher in Vitamin B6 content than 73% of foods
Snapper calories (kcal)
| Serving Size | Calories | Weight |
|---|---|---|
| Calories in 100 grams | 128 | |
| Calories in 3 oz | 109 | 85 g |
| Calories in 1 fillet | 218 | 170 g |
Snapper Glycemic index (GI)
Source:
*Explanation
Check out our Glycemic index chart page for the full list.
Mineral coverage chart
Calcium:
40 mg of 1,000 mg
4%
Iron:
0.24 mg of 8 mg
3%
Magnesium:
37 mg of 420 mg
9%
Phosphorus:
201 mg of 700 mg
29%
Potassium:
522 mg of 3,400 mg
15%
Sodium:
57 mg of 2,300 mg
2%
Zinc:
0.44 mg of 11 mg
4%
Copper:
0.046 mg of 1 mg
5%
Manganese:
0.017 mg of 2 mg
1%
Selenium:
49 µg of 55 µg
89%
Choline:
0 mg of 550 mg
0%
Mineral chart - relative view
Potassium
522 mg
TOP 12%
Selenium
49 µg
TOP 22%
Magnesium
37 mg
TOP 27%
Phosphorus
201 mg
TOP 37%
Calcium
40 mg
TOP 38%
Sodium
57 mg
TOP 67%
Zinc
0.44 mg
TOP 72%
Manganese
0.017 mg
TOP 80%
Copper
0.046 mg
TOP 82%
Iron
0.24 mg
TOP 87%
Vitamin coverage chart
Vitamin A:
115 IU of 5,000 IU
2%
Vitamin E :
0 mg of 15 mg
0%
Vitamin D:
0 µg of 10 µg
0%
Vitamin C:
1.6 mg of 90 mg
2%
Vitamin B1:
0.053 mg of 1 mg
4%
Vitamin B2:
0.004 mg of 1 mg
0%
Vitamin B3:
0.346 mg of 16 mg
2%
Vitamin B5:
0.87 mg of 5 mg
17%
Vitamin B6:
0.46 mg of 1 mg
35%
Folate:
6 µg of 400 µg
2%
Vitamin B12:
3.5 µg of 2 µg
146%
Vitamin K:
0 µg of 120 µg
0%
Vitamin chart - relative view
Vitamin B12
3.5 µg
TOP 21%
Vitamin B6
0.46 mg
TOP 27%
Vitamin C
1.6 mg
TOP 38%
Vitamin B5
0.87 mg
TOP 39%
Vitamin A
115 IU
TOP 41%
Vitamin B1
0.053 mg
TOP 70%
Folate
6 µg
TOP 76%
Vitamin B3
0.346 mg
TOP 83%
Vitamin B2
0.004 mg
TOP 96%
Macronutrients chart
Protein:
Daily Value: 53%
26.3 g of 50 g
53%
Fats:
Daily Value: 3%
1.72 g of 65 g
3%
Carbs:
Daily Value: 0%
0 g of 300 g
0%
Water:
Daily Value: 4%
70.35 g of 2,000 g
4%
Other:
1.63 g
Protein quality breakdown
Tryptophan:
294 mg of 280 mg
105%
Threonine:
1153 mg of 1,050 mg
110%
Isoleucine:
1212 mg of 1,400 mg
87%
Leucine:
2137 mg of 2,730 mg
78%
Lysine:
2415 mg of 2,100 mg
115%
Methionine:
778 mg of 1,050 mg
74%
Phenylalanine:
1027 mg of 1,750 mg
59%
Valine:
1355 mg of 1,820 mg
74%
Histidine:
774 mg of 700 mg
111%
Fat type information
Saturated Fat:
0.365 g
Monounsaturated Fat:
0.322 g
Polyunsaturated fat:
0.588 g
All nutrients for Snapper per 100g
| Nutrient | Value | DV% | In TOP % of foods | Comparison |
| Calories | 128kcal | 6% | 66% |
2.7 times more than Orange
|
| Protein | 26.3g | 63% | 11% |
9.3 times more than Broccoli
|
| Fats | 1.72g | 3% | 69% |
19.4 times less than Cheddar Cheese
|
| Vitamin C | 1.6mg | 2% | 38% |
33.1 times less than Lemon
|
| Net carbs | 0g | N/A | 75% |
N/A
|
| Carbs | 0g | 0% | 100% |
N/A
|
| Cholesterol | 47mg | 16% | 37% |
7.9 times less than Egg
|
| Iron | 0.24mg | 3% | 87% |
10.8 times less than Beef broiled
|
| Calcium | 40mg | 4% | 38% |
3.1 times less than Milk
|
| Potassium | 522mg | 15% | 12% |
3.6 times more than Cucumber
|
| Magnesium | 37mg | 9% | 27% |
3.8 times less than Almond
|
| Fiber | 0g | 0% | 100% |
N/A
|
| Copper | 0.05mg | 5% | 82% |
3.1 times less than Shiitake
|
| Zinc | 0.44mg | 4% | 72% |
14.3 times less than Beef broiled
|
| Phosphorus | 201mg | 29% | 37% |
1.1 times more than Chicken meat
|
| Sodium | 57mg | 2% | 67% |
8.6 times less than White Bread
|
| Vitamin A | 115IU | 2% | 41% |
145.3 times less than Carrot
|
| Vitamin A RAE | 35µg | 4% | 38% | |
| Selenium | 49µg | 89% | 22% | |
| Manganese | 0.02mg | 1% | 80% | |
| Vitamin B1 | 0.05mg | 4% | 70% |
5 times less than Pea raw
|
| Vitamin B2 | 0mg | 0% | 96% |
32.5 times less than Avocado
|
| Vitamin B3 | 0.35mg | 2% | 83% |
27.7 times less than Turkey meat
|
| Vitamin B5 | 0.87mg | 17% | 39% |
1.3 times less than Sunflower seed
|
| Vitamin B6 | 0.46mg | 35% | 27% |
3.9 times more than Oat
|
| Vitamin B12 | 3.5µg | 146% | 21% |
5 times more than Pork
|
| Folate | 6µg | 2% | 76% |
10.2 times less than Brussels sprout
|
| Saturated Fat | 0.37g | 2% | 73% |
16.2 times less than Beef broiled
|
| Monounsaturated Fat | 0.32g | N/A | 75% |
30.4 times less than Avocado
|
| Polyunsaturated fat | 0.59g | N/A | 58% |
80.2 times less than Walnut
|
| Tryptophan | 0.29mg | 0% | 50% |
Equal to Chicken meat
|
| Threonine | 1.15mg | 0% | 50% |
1.6 times more than Beef broiled
|
| Isoleucine | 1.21mg | 0% | 51% |
1.3 times more than Salmon raw
|
| Leucine | 2.14mg | 0% | 51% |
1.1 times less than Tuna Bluefin
|
| Lysine | 2.42mg | 0% | 48% |
5.3 times more than Tofu
|
| Methionine | 0.78mg | 0% | 46% |
8.1 times more than Quinoa
|
| Phenylalanine | 1.03mg | 0% | 53% |
1.5 times more than Egg
|
| Valine | 1.36mg | 0% | 50% |
1.5 times less than Soybean raw
|
| Histidine | 0.77mg | 0% | 55% |
Equal to Turkey meat
|
| Omega-3 - EPA | 0.05g | N/A | 35% |
14.4 times less than Salmon
|
| Omega-3 - DHA | 0.27g | N/A | 34% |
5.3 times less than Salmon
|
| Omega-3 - DPA | 0.02g | N/A | 37% |
7.7 times less than Salmon
|
Check out similar food or compare with current
NUTRITION FACTS LABEL
Nutrition Facts
___servings per container
Serving Size ______________
Serving Size ______________
Amount Per 100g
Calories 128
% Daily Value*
3%
Total Fat
2g
0%
Saturated Fat 0g
16%
Cholesterol 47mg
2%
Sodium 57mg
0%
Total Carbohydrate
0g
0%
Dietary Fiber
0g
Total Sugars g
Includes ? g Added Sugars
Protein
26g
Vitamin D
0mcg
0%
Calcium
40mg
4%
Iron
0mg
0%
Potassium
522mg
15%
*
The % Daily Value (DV) tells you how much a nutrient in a serving of food contributes to a daily diet. 2,000 calories a day is used for general nutrition advice.
Health checks
Low in Cholesterol
ⓘ
Dietary cholesterol is not associated with an increased risk of coronary heart disease in healthy individuals. However, dietary cholesterol is common in foods that are high in harmful saturated fats.
Source
No Trans Fats
ⓘ
Trans fat consumption increases the risk of cardiovascular disease and mortality by negatively affecting blood lipid levels.
Source
Low in Saturated Fats
ⓘ
Saturated fat intake can raise total cholesterol and LDL (low-density lipoprotein) levels, leading to an increased risk of atherosclerosis. Dietary guidelines recommend limiting saturated fats to under 10% of calories a day.
Source
Low in Sugars
ⓘ
While the consumption of moderate amounts of added sugars is not detrimental to health, an excessive intake can increase the risk of obesity, and therefore, diabetes.
Source
Snapper nutrition infographic
Infographic link
References
All the values for which the sources are not specified explicitly are taken from FDA’s Food Central. The exact link to the food presented on this page can be found below.