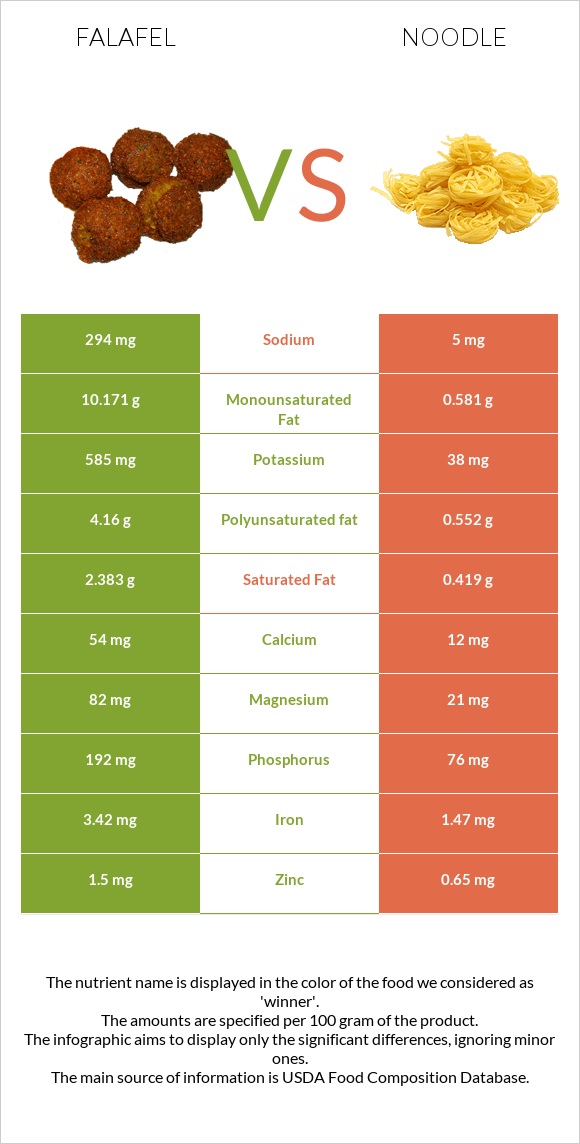
How are falafel and noodles different? Falafel is richer in iron, copper, phosphorus, manganese, potassium, and magnesium, while noodles is higher in selenium and vitamin B1. Noodles covers your daily need for selenium, 42% more than falafel. Falafel contains 59 times more sodium than noodles. Falafel contains 294mg of sodium, while noodles contains 5mg. Noodles has a higher glycemic index (50) than falafel (33). Falafel, home-prepared and Noodles, egg, enriched, cooked types were used in this article.
Infographic
Mineral Comparison
Mineral comparison score is based on the number of minerals by which one or the other food is richer. The "coverage" charts below show how much of the daily needs can be covered by 300 grams of the food.
8
100 g
300 g
1 patty (approx 2-1/4" dia) - 17g
Magnesium
Magnesium
Calcium
Calcium
Potassium
Potassium
Iron
Iron
Copper
Copper
Zinc
Zinc
Phosphorus
Phosphorus
Sodium
Sodium
Manganese
Manganese
Selenium
Selenium
59%
16%
52%
128%
86%
41%
82%
38%
90%
5.5%
2
100 g
300 g
1 cup - 160g
Magnesium
Magnesium
Calcium
Calcium
Potassium
Potassium
Iron
Iron
Copper
Copper
Zinc
Zinc
Phosphorus
Phosphorus
Sodium
Sodium
Manganese
Manganese
Selenium
Selenium
15%
3.6%
3.4%
55%
33%
18%
33%
0.65%
41%
130%
Vitamin Comparison
Vitamin comparison score is based on the number of vitamins by which one or the other food is richer. The "coverage" charts below show how much of the daily needs can be covered by 300 grams of the food.
3
100 g
300 g
1 patty (approx 2-1/4" dia) - 17g
Vitamin C
Vit. C
Vitamin D
Vit. D
Vitamin A
Vit. A
Vitamin E
Vit. E
Vitamin B1
Vit. B1
Vitamin B2
Vit. B2
Vitamin B3
Vit. B3
Vitamin B5
Vit. B5
Vitamin B6
Vit. B6
Vitamin B12
Vit. B12
Vitamin K
Vit. K
Folate
Folate
5.3%
0%
0.33%
0%
37%
38%
20%
18%
29%
0%
0%
70%
6
100 g
300 g
1 cup - 160g
Vitamin C
Vit. C
Vitamin D
Vit. D
Vitamin A
Vit. A
Vitamin E
Vit. E
Vitamin B1
Vit. B1
Vitamin B2
Vit. B2
Vitamin B3
Vit. B3
Vitamin B5
Vit. B5
Vitamin B6
Vit. B6
Vitamin B12
Vit. B12
Vitamin K
Vit. K
Folate
Folate
0%
1.5%
2%
3.4%
72%
31%
39%
16%
11%
11%
0%
63%
All nutrients comparison - raw data values
Nutrient
DV% diff.
Selenium
1µg
23.9µg
42%
Fats
17.8g
2.07g
24%
Iron
3.42mg
1.47mg
24%
Monounsaturated fat
10.171g
0.581g
24%
Polyunsaturated fat
4.16g
0.552g
24%
Protein
13.31g
4.54g
18%
Copper
0.258mg
0.098mg
18%
Phosphorus
192mg
76mg
17%
Potassium
585mg
38mg
16%
Manganese
0.691mg
0.315mg
16%
Magnesium
82mg
21mg
15%
Sodium
294mg
5mg
13%
Vitamin B1
0.146mg
0.289mg
12%
Calories
333kcal
138kcal
10%
Cholesterol
0mg
29mg
10%
Saturated fat
2.383g
0.419g
9%
Zinc
1.5mg
0.65mg
8%
Vitamin B3
1.044mg
2.077mg
6%
Vitamin B6
0.125mg
0.046mg
6%
Fiber
1.2g
5%
Choline
25.7mg
5%
Calcium
54mg
12mg
4%
Vitamin B12
0µg
0.09µg
4%
Vitamin C
1.6mg
0mg
2%
Carbs
31.84g
25.16g
2%
Vitamin B2
0.166mg
0.136mg
2%
Folate
93µg
84µg
2%
Vitamin D*
0 IU
4 IU
1%
Vitamin D
0µg
0.1µg
1%
Vitamin A
1µg
6µg
1%
Vitamin E
0.17mg
1%
Vitamin B5
0.292mg
0.263mg
1%
Protein per 100 calories
4g
3.3g
N/A
Calories per 10 g protein
250kcal
304kcal
N/A
Weight per 100 calories
30g
72g
N/A
Unsaturated / Saturated Fat ratio
6
2.7
N/A
Net carbs
31.84g
23.96g
N/A
Sugar
0.4g
N/A
Trans fat
0g
0.029g
N/A
Tryptophan
0.134mg
0.043mg
0%
Threonine
0.492mg
0.138mg
0%
Isoleucine
0.567mg
0.19mg
0%
Leucine
0.944mg
0.365mg
0%
Lysine
0.856mg
0.137mg
0%
Methionine
0.187mg
0.086mg
0%
Phenylalanine
0.707mg
0.24mg
0%
Valine
0.562mg
0.22mg
0%
Histidine
0.364mg
0.121mg
0%
Macronutrient Comparison
Macronutrient breakdown side-by-side comparison
4
13%
18%
32%
35%
2%
Protein:
13.31 g
Fats:
17.8 g
Carbs:
31.84 g
Water:
34.62 g
Other:
2.43 g
1
5%
2%
25%
68%
Protein:
4.54 g
Fats:
2.07 g
Carbs:
25.16 g
Water:
67.73 g
Other:
0.5 g
Contains
more
Protein Protein
+193.2%
Contains
more
Fats Fats
+759.9%
Contains
more
Carbs Carbs
+26.6%
Contains
more
Other Other
+386%
Contains
more
Water Water
+95.6%
Fat Type Comparison
Fat type breakdown side-by-side comparison
2
14%
61%
25%
Saturated fat:
Sat. Fat
2.383 g
Monounsaturated fat:
Mono. Fat
10.171 g
Polyunsaturated fat:
Poly. Fat
4.16 g
1
27%
37%
36%
Saturated fat:
Sat. Fat
0.419 g
Monounsaturated fat:
Mono. Fat
0.581 g
Polyunsaturated fat:
Poly. Fat
0.552 g
Contains
more
Mono. Fat Monounsaturated fat
+1650.6%
Contains
more
Poly. Fat Polyunsaturated fat
+653.6%
Contains
less
Sat. Fat Saturated fat
-82.4%