Blueberry vs. Grape — Health Impact and Nutrition Comparison


Summary
Grapes are higher in calories, fats, and carbs, while blueberries contain more protein. Blueberries are overall richer in minerals and vitamins, containing higher levels of vitamin C, vitamin E, vitamins B3, B5, and B9, zinc, copper, magnesium, and phosphorus. On the other hand, grapes are richer in vitamin A, vitamins B1, B2, and B6, calcium, and potassium. Blueberries are lower in sodium.
Grapes and blueberries are high in polyphenols, such as anthocyanins and resveratrol, responsible for various health benefits, such as decreasing the risks of cardiovascular disease, type 2 diabetes, and cancer.
Both of these fruits are high in nutrients and possess numerous beneficial properties. The final choice is up to personal preference.
Table of contents
Introduction
It is not wrong to assume that fruits in similar colors share certain traits, as is the case with blueberries and black grapes. In this article, we will talk about these similarities, as well as their differences, with nutrition and health impact at the center of attention.
Classification
Blueberries and grapes are both flowering plants, botanically classified as berries. Blueberries belong to the Cyanococcus section of the Vaccinium genus and the Ericaceae family. Blueberries share their genus with bilberries, huckleberries, and cranberries.
Grapes are part of the Vitis genus in the Vitaceae family. The Vitis genus is also known as the grapevine genus.
Appearance
Blueberries grow on bushes of two varieties - highbush (cultivated) and lowbush (wild). Mature blueberries are, according to their name, blue, globular, and with a crown formation at the top.
It is well known that grapes grow on vines in clusters. All grapes have fleshy insides and thin skin in green, yellow, or purple shades. The shape of grapes varies from globular to oblong. Depending on the variety, grapes can be seeded or seedless.
Taste and Use
Grapes and blueberries can both taste anywhere from tart to sweet, and at times they taste like both at the same time.
Blueberries and grapes are most often used raw. They can also be used in the production of various dairies, pastries, and chocolates.
While blueberry wine is a traditional fermented alcoholic drink in North America, grape wine is one of the most popular alcoholic drinks in the world, dating back millennia.
Varieties
The two main distinctive types of blueberries are highbush or cultivated blueberries and lowbush or wild blueberries. Of these, the five major varieties of blueberries grown in the United States are lowbush, northern highbush, southern highbush, rabbiteye, and half-high. Each of these varieties includes numerous cultivars. The most common variety in the world is the northern highbush (1).
Grapes have hundreds of varieties from all around the world. The main categorization of grapes is decided by three factors: usage, color, and composition. Based on usage, these fruits are categorized as table grapes or wine grapes. Based on color, they can be white or green and black or red. And lastly, based on composition, grapes can be seeded or seedless.
Nutrition
For this article, we are looking at the nutritional values of raw blueberries and raw, American-type slip-skin grapes.
Macronutrients and Calories
Grapes and blueberries are similar in their macronutrient compositions; however, grapes are a little denser in nutrients. Grapes consist of 81% water, while the water percentage in blueberries is 84.
The average serving size for both of these fruits is one cup. But one cup of blueberries weighs 148g, whereas the mass of a cup of grapes is 92g.
Calories
Like most fruits, grapes and blueberries are both low-calorie foods. Grapes are a little higher in calories compared to blueberries.
Protein and Fats
While the difference is not substantial, blueberries are a little richer in protein, and grapes are higher in fats.
Blueberries contain some level of all essential amino acids, while grapes lack isoleucine and leucine.
The predominant fats found in blueberries are healthy polyunsaturated fatty acids. Grapes, on the other hand, contain more saturated fats.
Both grapes and blueberries naturally contain no cholesterol.
Carbohydrates
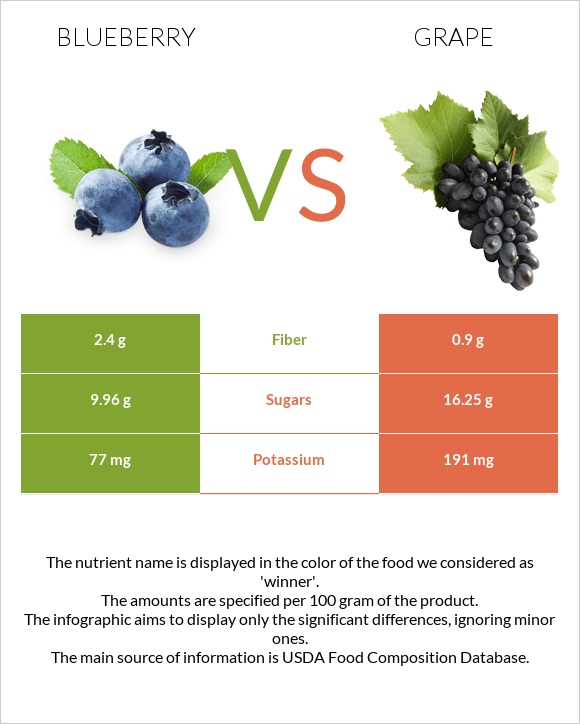
Grapes contain a larger amount of carbohydrates due to high levels of sugar. However, blueberries have more dietary fiber in comparison to grapes.
The predominant sugars found in blueberries are glucose and fructose. Blueberries also contain low levels of starch and sucrose.
Vitamins
Blueberries and grapes are both rich in vitamins; however, blueberries overall contain a little more. Blueberries are richer in vitamin E, vitamin C, vitamin K, vitamin B5, vitamin B3 and the folate form of vitamin B9.
Grapes, on the other hand, contain larger amounts of vitamin A, vitamin B1, vitamin B2, and vitamin B6.
Both blueberries and grapes completely lack vitamin D and vitamin B12.
Vitamin Comparison
Contains
more
Vitamin CVitamin C
+142.5%
Contains
more
Vitamin EVitamin E
+200%
Contains
more
Vitamin B3Vitamin B3
+39.3%
Contains
more
Vitamin B5Vitamin B5
+416.7%
Contains
more
Vitamin KVitamin K
+32.2%
Contains
more
FolateFolate
+50%
Contains
more
Vitamin AVitamin A
+66.7%
Contains
more
Vitamin B1Vitamin B1
+148.6%
Contains
more
Vitamin B2Vitamin B2
+39%
Contains
more
Vitamin B6Vitamin B6
+111.5%
Minerals
Blueberries win in the mineral category as well, being richer in zinc, copper, magnesium, phosphorus, and choline. Blueberries are also lower in sodium.
However, grapes are rich in minerals too. Grapes contain higher levels of calcium, potassium, and manganese.
Grapes and blueberries contain nearly the same amounts of iron and selenium.
Mineral Comparison
Contains
more
MagnesiumMagnesium
+20%
Contains
more
CopperCopper
+42.5%
Contains
more
ZincZinc
+300%
Contains
more
PhosphorusPhosphorus
+20%
Contains
less
SodiumSodium
-50%
Contains
more
CalciumCalcium
+133.3%
Contains
more
PotassiumPotassium
+148.1%
Contains
more
ManganeseManganese
+113.7%
Glycemic Index
According to The International Tables of Glycemic Indices, the glycemic index of wild blueberries from Canada falls in the range of 53±7 (2).
The glycemic index of grapes varies depending on growing conditions. Raw grapes from Canada have a glycemic index of 43, while grapes from Italy have a GI of 49. Grapes from Australia, however, have a higher GI of 59 (2).
Based on these numbers, most blueberries and grapes are classified as low glycemic index foods with similar glycemic indices.
Acidity
Frozen blueberries have been found to have a very acidic pH of 3.11 to 3.22 (3).
The pH of grapes can change depending on their variety. The exact number may fall anywhere from 2.8 to 3.8 (3). This makes the pH of grapes also acidic.
The potential renal acid load or PRAL is an alternative way of looking at the acidity of foods. The PRAL value demonstrates how much base or acid the food produces inside the body.
The PRAL value for blueberries has been calculated to be -1, while the PRAL value for grapes is -3.6. This means grapes are more alkaline-producing inside the organism when compared to blueberries.
Weight Loss & Diets
Blueberries and grapes are both low glycemic index foods that generally fit well in weight loss diets. In comparison, blueberries are the preferred choice between the two during low-calorie and low-carb diets.
Overall, increased consumption of fruits has been studied to have an inverse association with weight gain and weight change. In a comparison of the effects of sixteen common fruits, blueberry intake showed the least weight gain (4).
Higher habitual intake of flavonoids, such as anthocyanins, are associated with lower fat mass, independent of genetic traits and environment (5). Black grapes, and especially blueberries, are rich in anthocyanins.
Grapes are also rich in a compound called resveratrol. At higher doses, resveratrol has been demonstrated to significantly attenuate weight gain in mice (6).
Grape seed extract intake has also expressed beneficial properties for the suppression of obesity induced by a high-fat diet (7).
Health Impact
Health Benefits
The dark coloring of blueberries and black grapes owes to a phytochemical named anthocyanin contained in both of these fruits. As shown before, anthocyanins are responsible for many beneficial qualities that blueberries and grapes possess. Blueberries contain almost three times more anthocyanins in comparison to purple grapes (8).
Cardiovascular Health
Higher flavonoid intake, anthocyanins, in particular, has been correlated with a reduction in the risk of cardiovascular and all-cause mortality (9). Other studies have shown the dietary intake of anthocyanins reduces the risk of cardiovascular diseases, such as coronary artery disease, fatal and non-fatal myocardial infarction, and hypertension (8).
Berry intake is said to slow atherosclerosis progression and preserve blood pressure and vascular function by preventing the generation of free radicals, attenuating inflammatory gene expression, and upregulating endothelial nitric oxide content. Berries can also downregulate foam cell formation, which plays a significant role in the development of atherosclerosis (10).
Epidemiological studies show that consumption of grapes, wine, and other grape products is correlated with a decreased risk of cardiovascular disease. Polyphenols, found in grapes, potentially reduce atherosclerosis risk by inhibiting platelet aggregation, improving endothelial function, lowering blood pressure, inhibiting the oxidation of low-density lipoproteins, and reducing inflammation (11).
In addition, blueberry and grape seed and skin contain chemicals that, like some antihypertensive medicines (Captopril, Lisinopril, etc.), may lower arterial blood pressure by inhibiting angiotensin-converting enzymes (ACE). ACE inhibitors may help prevent myocardial and blood vessel remodeling, which is significant for those with high blood pressure and coronary artery disease (12.13).
Diabetes
Multiple studies have found an association between anthocyanin and blueberry consumption and a decreased risk of prediabetes or type 2 diabetes mellitus (8).
The antidiabetic properties of blueberries are said to be expressed by increasing insulin sensitivity, reducing body fat, inhibiting inflammatory responses, and modifying insulin-dependent and independent cellular pathways (14).
Grapes and grape products are rich in polyphenols with antioxidant and anti-inflammatory properties, which may express protective effects against metabolic disorders that occur in type 2 diabetes (15).
Polyphenols in grapes, such as quercetin, myricetin, and resveratrol, possess a strong ability to ameliorate biological mechanisms responsible for hyperglycemia (16).
Cancer
Due to the high content of polyphenols and vitamins found in both of these fruits, they possess significant antioxidant and anti-inflammatory qualities. These properties can help inhibit cancer cell formation and increase apoptosis (17).
There have been studies showing the chemoprotective ability of grapes or grape products against cancers of skin, colorectum, prostate, and breast, as well as lung and gastric cancers (18).
Studies about the chemoprotective properties of blueberries have revolved around gastrointestinal cancers, breast cancer, and endothelial cell neoplasms (17).
There is also probable evidence that dietary fiber decreases the risk of colorectal cancer and that consumption of fruits and non-starchy vegetables combined reduces the risk of aerodigestive cancers, such as mouth, pharynx, larynx, esophagus, lung, stomach, and colorectal cancers (19.20).
Limited suggestive evidence can be found that fruit, especially rich in vitamin C, may decrease the risk of lung cancer (19.20).
Other Benefits
Anthocyanins found in blueberries have been studied to possess neuroprotective properties and ocular disease risk-reducing qualities (8).
According to this study, a polyphenol-rich grape and blueberry extract reduces age-related episodic memory decline in people with cognitive deficits (21).
Downsides and Risks
Fruits grown with the aid of pesticides may carry pesticide residue as a result. Both blueberries and grapes can be treated with pesticides. Consumption of organic fruits reduces this risk.
References
- Common Types Of Blueberries: Best Varieties Of Blueberry For Gardens
- https://academic.oup.com/ajcn/article/114/5/1625/6320814
- pH values of foods and food products
- https://pubmed.ncbi.nlm.nih.gov/26394033/
- https://pubmed.ncbi.nlm.nih.gov/28100511/
- https://www.nature.com/articles/pr2007137
- https://pubmed.ncbi.nlm.nih.gov/22754935/
- https://academic.oup.com/advances/article/11/2/224/5536953
- https://pubmed.ncbi.nlm.nih.gov/28472215/
- https://www.ncbi.nlm.nih.gov/pmc/articles/PMC3068482/
- https://www.ncbi.nlm.nih.gov/pmc/articles/PMC2728695/
- https://www.sciencedirect.com/science/article/abs/pii/S030881461401053X
- https://ift.onlinelibrary.wiley.com/doi/abs/10.1111/1750-3841.13706
- https://www.ncbi.nlm.nih.gov/pmc/articles/PMC5187542/
- https://academic.oup.com/jn/article/139/9/1794S/4670548
- https://www.ncbi.nlm.nih.gov/pmc/articles/PMC5481737/
- https://pubmed.ncbi.nlm.nih.gov/23387969/
- https://www.ncbi.nlm.nih.gov/pmc/articles/PMC2728696/
- https://www.aicr.org/cancer-prevention/food-facts/blueberries/
- https://www.aicr.org/cancer-prevention/food-facts/grapes/
- https://academic.oup.com/biomedgerontology/article/74/7/996/5056005

Infographic
All nutrients comparison - raw data values
| Nutrient | |
|
DV% diff. |
| Manganese | 0.336mg | 0.718mg | 17% |
| Vitamin C | 9.7mg | 4mg | 6% |
| Fiber | 2.4g | 0.9g | 6% |
| Fructose | 4.97g | 6% | |
| Vitamin B1 | 0.037mg | 0.092mg | 5% |
| Vitamin B6 | 0.052mg | 0.11mg | 4% |
| Vitamin K | 19.3µg | 14.6µg | 4% |
| Potassium | 77mg | 191mg | 3% |
| Vitamin E | 0.57mg | 0.19mg | 3% |
| Copper | 0.057mg | 0.04mg | 2% |
| Vitamin B5 | 0.124mg | 0.024mg | 2% |
| Calories | 57kcal | 67kcal | 1% |
| Carbs | 14.49g | 17.15g | 1% |
| Calcium | 6mg | 14mg | 1% |
| Zinc | 0.16mg | 0.04mg | 1% |
| Vitamin B2 | 0.041mg | 0.057mg | 1% |
| Vitamin B3 | 0.418mg | 0.3mg | 1% |
| Folate | 6µg | 4µg | 1% |
| Protein | 0.74g | 0.63g | 0% |
| Protein per 100 calories | 1.3g | 0.94g | N/A |
| Calories per 10 g protein | 770kcal | 1063kcal | N/A |
| Weight per 100 calories | 175g | 149g | N/A |
| Fats | 0.33g | 0.35g | 0% |
| Net carbs | 12.09g | 16.25g | N/A |
| Magnesium | 6mg | 5mg | 0% |
| Iron | 0.28mg | 0.29mg | 0% |
| Sugar | 9.96g | 16.25g | N/A |
| Starch | 0.03g | 0% | |
| Phosphorus | 12mg | 10mg | 0% |
| Sodium | 1mg | 2mg | 0% |
| Vitamin A | 3µg | 5µg | 0% |
| Selenium | 0.1µg | 0.1µg | 0% |
| Choline | 6mg | 5.6mg | 0% |
| Saturated fat | 0.028g | 0.114g | 0% |
| Monounsaturated fat | 0.047g | 0.014g | 0% |
| Polyunsaturated fat | 0.146g | 0.102g | 0% |
| Tryptophan | 0.003mg | 0.003mg | 0% |
| Threonine | 0.02mg | 0.017mg | 0% |
| Isoleucine | 0.023mg | 0.005mg | 0% |
| Leucine | 0.044mg | 0.013mg | 0% |
| Lysine | 0.013mg | 0.014mg | 0% |
| Methionine | 0.012mg | 0.021mg | 0% |
| Phenylalanine | 0.026mg | 0.013mg | 0% |
| Valine | 0.031mg | 0.017mg | 0% |
| Histidine | 0.011mg | 0.023mg | 0% |
Macronutrient Comparison
| Contains more ProteinProtein | +17.5% |
| Contains more CarbsCarbs | +18.4% |
| Contains more OtherOther | +147.8% |
Fat Type Comparison
| Contains less Sat. FatSaturated fat | -75.4% |
| Contains more Mono. FatMonounsaturated fat | +235.7% |
| Contains more Poly. FatPolyunsaturated fat | +43.1% |
People also compare


References
All the values for which the sources are not specified explicitly are taken from FDA’s Food Central. The exact link to the food presented on this page can be found below.
- Blueberry - https://fdc.nal.usda.gov/fdc-app.html#/food-details/171711/nutrients
- Grape - https://fdc.nal.usda.gov/fdc-app.html#/food-details/174682/nutrients
All the Daily Values are presented for males aged 31-50, for 2000-calorie diets.