Blueberry Nutrition, Glycemic Index, Calories, Net Carbs & More

Summary
The primary nutrient found in blueberries is carbohydrates, composed of 83% net carbs and 17% dietary fiber. Blueberries are also an excellent source of vitamin C, vitamin K, manganese, and protective antioxidants, such as anthocyanins.
Introduction
Blueberries, like most berries, are widely popular constituents of healthy diets, but what nutrition do they provide, and how does it affect our health? In this article, we will be discussing exactly that.
Nutrition
The nutritional information and infographics below will be presented mainly for raw blueberries, with occasional mentions of the nutritional content of dried blueberries.
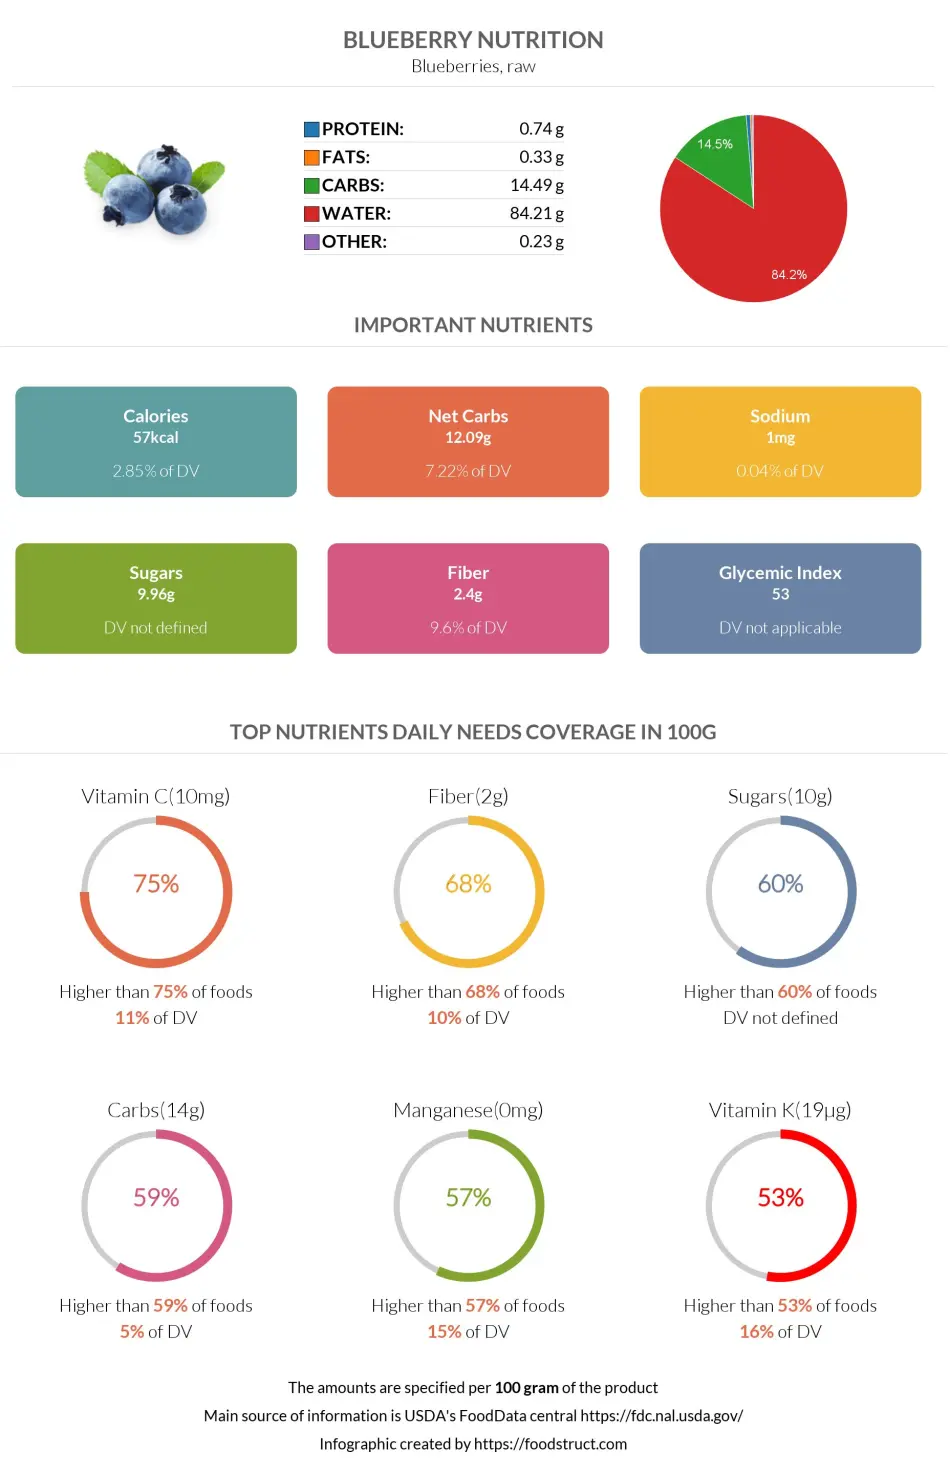
Raw blueberries are not very dense in nutrients, consisting of 85% water and 15% nutrients. Conversely, dried blueberries contain 15% water and 85% nutrients.
One average serving size of blueberries per person is one cup, equalling 148g, which is around 65 to 75 blueberries.
Macronutrients chart
Calories
Raw blueberries are low-calorie foods. One hundred grams of blueberries provides only 57 calories. Hence, as a low-calorie but nutrient-dense food, blueberries are a great addition to many diets, including weight loss diets.
Accordingly, one average serving of blueberries (1 cup or 148 grams) per person contains 84 calories.
Dried sweetened blueberries, being denser in nutrients, are significantly higher in calories, although their serving sizes are usually much smaller. A hundred grams of dried sweetened blueberries contains 317 calories.
What Do 57 Calories or 100 Grams of Blueberries Look Like?
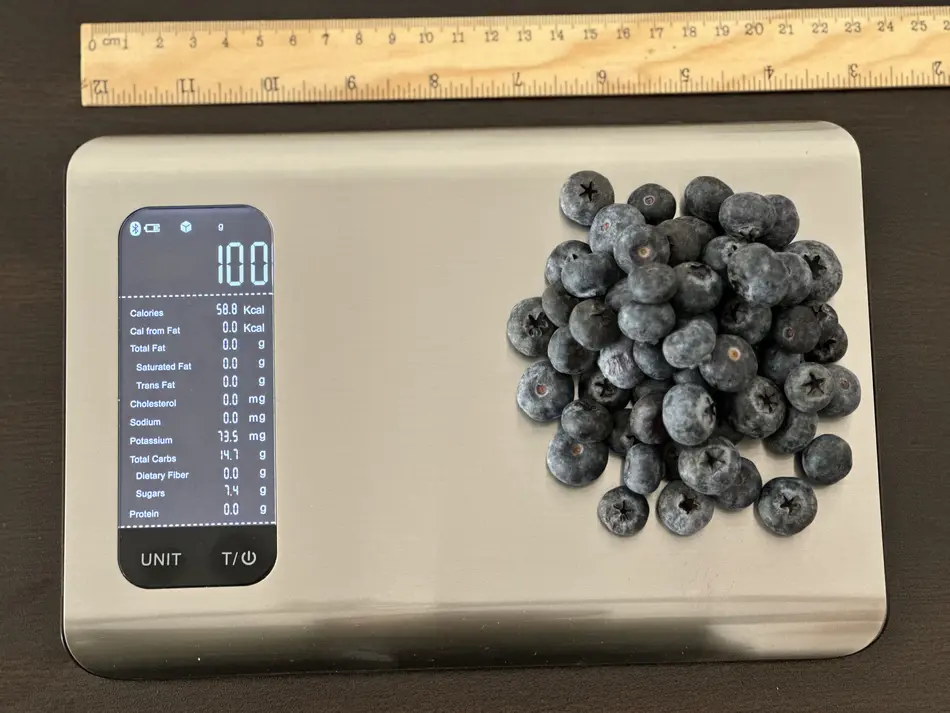
We measured how much 100 grams of blueberries looks like to help you understand its weight and calories. The picture above shows that 63 blueberries comprise 100 grams (57-58 calories). That means each blueberry is about 1.6 grams or around 0.9-1 calories. However, calories can change based on how big, ripe, or heavy the blueberries are, as unripe blueberries have lower sugar levels and fewer calories than fully ripe ones.
Protein
Blueberries contain very little protein – less than one gram per 100g serving. Nonetheless, this low content of protein contains small amounts of all essential amino acids.
Dried sweetened blueberries, on the other hand, provide 2.5g of protein per 100g serving.
Protein quality breakdown
Carbohydrates
Carbohydrates are the main macronutrients found in blueberries, making up almost 15% of the total content of these fruits. Therefore, a 100-gram serving of blueberries contains 14.5g of carbohydrates.
Of these carbohydrates, 83% are made up of net carbs and 17% dietary fiber.
Dried sweetened blueberries are naturally significantly higher in carbohydrates, containing 80g of carbohydrates per 100g serving. This carbohydrate content consists of 91% net carbs and 9% dietary fiber.
Carbohydrate type breakdown
Net Carbs
One average serving of raw blueberries contains 18g of net carbs.
The predominant sugars making up blueberries’ sugar content are fructose and glucose. Blueberries may also contain small amounts of sucrose and starch.
One cup of raw blueberries (148g) provides 7.4g of fructose and 7.2g of glucose.
Dietary Fiber
A cup of blueberries contains 3.6 grams of fiber.
Blueberries contain the same amount of dietary fiber as oranges.
The dietary fiber content of blueberries consists of 29% soluble and 71% insoluble fiber (1). Soluble fiber slows down and improves digestion, while insoluble fiber helps with constipation.
Fiber content ratio for Blueberry
Fats
Raw blueberries contain a negligible amount of fats - 0.3g in a 100g serving.
At the same time, dried sweetened blueberries can provide 2.5g of fats in the same serving size. Most of these fats are made up of healthful polyunsaturated fatty acids.
Like all plant products, blueberries do not contain cholesterol.
Fat type information
Vitamins
Despite the overall low nutrient content, blueberries are a rich source of vitamins. The predominant vitamins found in blueberries are vitamin K and vitamin C.
Blueberries fall in the top 25% of foods as a source of vitamin C. A 100g serving of blueberries covers 11% of the daily need for this vitamin.
The same serving size of blueberries also covers 16% of the daily vitamin K needs.
Blueberries provide moderate amounts of vitamin E, vitamin A, and all B group vitamins except for vitamin B12, which it lacks completely.
Blueberries are also entirely absent in vitamin D.
Vitamin coverage chart
Minerals
Blueberries are an excellent source of manganese, covering 15% of the daily need for this mineral with a 100g serving.
Blueberries contain adequate amounts of copper and iron. In smaller amounts, these berries contain other minerals, such as zinc, potassium, calcium, magnesium, phosphorus, and selenium.
Blueberries are very low in sodium, containing only 1mg in a 100g serving.
Mineral coverage chart
Oxalates
Oxalates are compounds found in plants, which, when consumed, may bind to calcium, increasing the risk of kidney stone formation. Blueberries are low in oxalates, containing around 3.2mg of oxalates per 100 grams (2).
Phytochemicals
Besides the widely known nutrients, plant products are also rich in specific compounds called phytochemicals, which gives these foods many of their attributes. Many of the health benefits of blueberries have been linked to the presence of these phytochemicals.
Anthocyanins
Blueberries are one of the richest sources of the phenolic compound anthocyanins. This pigment is what gives blueberries their distinct dark color. As the fruit ripens, the anthocyanin content grows, and the berry gets darker (3).
Anthocyanins are strong antioxidants necessary to protect cells from oxidative cell damage. This gives blueberries health-beneficial qualities that can help prevent cardiovascular diseases and type 2 diabetes as well as boost cognition and brain function (3).
Polyphenols
Other than anthocyanins, blueberries are also rich in antioxidant polyphenols, such as various phenolic acids, cinnamic acids, and flavonoids (4). These compounds add to the valuable, healthy qualities of blueberries.
Specifically, blueberries have been studied to be an excellent source of various flavonols, including quercetin and myricetin. One research found that the predominant flavonol in blueberries is quercetin (5). In fact, the content was found to be so high that the authors ranked it as 2nd among 100 other fruits and vegetables in terms of quercetin content.
Organic Acids
Blueberries contain large amounts of organic acids, such as citric acid, quinic acid, malic acid, oxalic acid, and others (6). These acids are responsible for the slightly tart taste of blueberries.
Glycemic Index
According to the International Tables of Glycemic Index Values 2021, wild blueberries from Canada have a glycemic index of 53±7 (7). This puts the glycemic index of blueberries in the low category.
Refer to our blog article to read more about the glycemic index and glycemic load values of blueberries. To find the complete glycemic index list of over 600 foods, you can visit this page.
Acidity
The pH value of blueberries has been researched to fall in the range of 3.44 to 4.14 (8). This makes blueberries an acidic food.
The pH value of frozen blueberries falls in the range of 3.11 to 3.22, making frozen berries a little more acidic (9).
The potential renal acid load or PRAL value of foods is another way of measuring acidity by looking at how much acid or base the given food produces inside the organism. The PRAL value of blueberries is -1. The negative value shows these berries to be slightly alkaline-forming.
Nutritional Comparison of Wild (Lowbush) and Cultivated (Highbush) Blueberries
Highbush or cultivated blueberries and lowbush or wild blueberries have been extensively studied as they are the two main varieties of blueberries. The nutritional compositions of various blueberry types have shown distinct variations.
Minerals in Wild and Cultivated Blueberries
In one study, wild blueberries (Vaccinium myrtillus L.) were found to have higher levels of various minerals, including calcium, sodium, magnesium, as well as manganese and zinc, when compared to cultivated blueberries (Vaccinium corymbosum) (10).
Similar levels of other minerals, such as copper, chromium, iron, and nickel, were detected in both.
Nevertheless, both are excellent sources of various minerals, essential for health and development.
Phytochemicals in Wild and Cultivated Blueberries
Kalt et al. found that lowbush blueberries had higher contents of anthocyanins and total phenols but also a better antioxidant capacity than highbush blueberries (11). Moreover, in another study, the authors observed the differences in anthocyanin content among blueberry variants and concluded that although these differences exist, they most likely are not the primary factors responsible for the differences in antioxidant capacities (12).
Similarly, Kang et al. found that the total phenolic content in wild or lowbush blueberries (V. angustifolium) was around three times higher than that of highbush blueberries (V. corymbosum); however, the antioxidant capacity and the anti-inflammatory effects of free phenolic acids in both were found to be mild, hinting that other compounds within the two might be responsible for these effects (13).
A different study by Saral et al. revealed that wild blueberry species exhibited better antioxidant capacity than the cultivated species while also containing higher levels of total phenols, flavonoids, and anthocyanins (14).
Nevertheless, both wild and cultivated blueberries are healthy additions to any diet with demonstrated antioxidant and anti-inflammatory capacities.
Nutritional Comparison of Fresh, Dried, and Frozen Blueberries
When comparing the same serving of fresh blueberries to dried, sweetened blueberries, we see that dried blueberries have relatively more copper and iron but less manganese. Similarly, dried blueberries have more of the most vitamins, including vitamin K, vitamin C, and vitamin E.
However, we should keep in mind that dried blueberries have a much smaller serving size than fresh blueberries. Their macronutrient composition is made of mostly carbs, whereas fresh blueberries consist of 84% water. Hence, the same serving of dried blueberries is much more nutrient dense than fresh blueberries. To learn more about the nutritional differences, check out this article comparing fresh and dried blueberries.
We can also compare fresh blueberries to frozen, sweetened blueberries. Fresh and frozen blueberries have similar macronutrient compositions, as well as vitamin and mineral content. However, fresh blueberries are much richer in vitamin C than frozen blueberries. To learn more about the differences, check our comparison article between fresh and frozen blueberries.

Comparison to Similar Foods
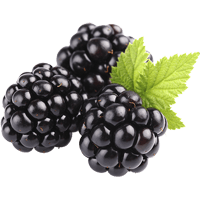
When comparing blueberries and blackberries, we see that blackberries are richer in vitamin C and lower in carbohydrates and sugars, while blueberries contain more vitamins B1, B5, and B6. You can find a full article on “Blueberry vs. Blackberry.”
Compared to blueberries, grapes are higher in calories, fats, and carbs. On the other hand, blueberries are overall richer in minerals and vitamins. If interested, you can also find the complete comparison of “Blueberry vs. Grape.”
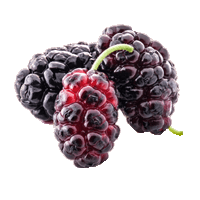
In comparison to mulberries, blueberries are richer in carbohydrates, including net carbs and dietary fiber, vitamins A and K. Mulberries, however, are a better source of vitamin C, vitamin B2, and most minerals.
References
- https://sci.washington.edu/info/forums/reports/FiberFacts.pdf
- https://www.researchgate.net/publication/259133562
- https://www.ncbi.nlm.nih.gov/pmc/articles/PMC7442370/
- https://repositorio.ucp.pt/bitstream/10400.14/26046/4/Health%20promoting%20properties%20of%20blueberries-%20a%20review.pdf
- https://www.sciencedirect.com/science/article/abs/pii/S0889157511001219
- https://www.researchgate.net/publication/343491639
- https://academic.oup.com/ajcn/article/114/5/1625/6320814
- https://cdn.blueberriesconsulting.com/2020/12/applsci-10-08459.pdf
- https://www.arrowscientific.com.au/index.php?option=com_content&view=article&id=61:ph-values-of-foods-and-food-products
- https://www.ncbi.nlm.nih.gov/pmc/articles/PMC5747577/
- https://pubmed.ncbi.nlm.nih.gov/11600018/
- https://cdnsciencepub.com/doi/pdf/10.4141/P99-009
- https://pubmed.ncbi.nlm.nih.gov/25535004/
- https://www.researchgate.net/publication/316450510

Top nutrition facts for Blueberry
| Calories ⓘ Calories for selected serving | 57 kcal |
|
Glycemic index ⓘ
Source:
Check out our Glycemic index chart page for the full list.
|
53 (low) |
| Glycemic load ⓘ Glycemic Load (GL) is a metric that measures both the quality (Glycemic Index) and quantity of carbohydrates in a specific serving of food to estimate its impact on blood sugar levels. It is calculated as: (GI × Carbs in grams) / 100. | 9 (low) |
| Net carbs ⓘ Net Carbs = Total Carbohydrates – Fiber – Sugar Alcohols | 12 g |
| Default serving size ⓘ Serving sizes are mostly taken from FDA's Reference Amounts Customarily Consumed (RACCs) | 1 cup (148 g) |
| Acidity (Based on PRAL) ⓘ PRAL (Potential renal acid load) is calculated using a formula. On the PRAL scale the higher the positive value, the more is the acidifying effect on the body. The lower the negative value, the higher the alkalinity of the food. 0 is neutral. | -1 (alkaline) |
| Oxalates | 3 mg ⓘ https://www.researchgate.net/publication/259133562 |
Blueberry calories (kcal)
| Calories for different serving sizes of blueberry | Calories | Weight |
|---|---|---|
| Calories in 100 grams | 57 | |
| Calories in 50 berries | 39 | 68 g |
| Calories in 1 cup | 84 | 148 g |
| Calories for different varieties of blueberry | Calories | Weight |
|---|---|---|
| Blueberries, raw (this food) | 57 | 100 g |
| Blueberries, frozen, unsweetened | 51 | 100 g |
| Blueberries, wild, frozen | 57 | 100 g |
| Blueberries, frozen, sweetened | 85 | 100 g |
| Blueberries, canned, light syrup, drained | 88 | 100 g |
| Blueberries, wild, canned, heavy syrup, drained | 107 | 100 g |
| Blueberries, dried, sweetened | 317 | 100 g |
Extra Nutrition facts for Blueberry
| Protein per 100 calories ⓘ Shows how many grams of protein you get from 100 calories of this food, calculated as (protein in g ÷ calories) × 100. | 1.3 g |
| Calories per 10 g protein ⓘ Shows how many calories you need to eat from this food to get 10 g of protein, calculated as (calories ÷ protein in g) × 10. | 770 kcal |
| Weight per 100 calories ⓘ Shows how many grams of this food equal 100 kcal—higher grams mean a larger portion for the same calories. | 175 g |
Blueberry Glycemic index (GI)
Blueberry Glycemic load (GL)
Mineral chart - relative view
Vitamin chart - relative view
All nutrients for Blueberry per 100g
| Nutrient | Value | DV% | In TOP % of foods | Comparison |
| Vitamin A | 3µg | 0% | 45% | |
| Calories | 57kcal | 3% | 85% |
1.2 times more than Orange
|
| Protein | 0.74g | 2% | 88% |
3.8 times less than Broccoli
|
| Calories per 10 g protein | 770kcal | N/A | 15% | |
| Weight per 100 calories | 175g | N/A | 16% | |
| Protein per 100 calories | 1.3g | N/A | 81% | |
| Fats | 0.33g | 1% | 84% |
100.9 times less than Cheese
|
| Vitamin C | 9.7mg | 11% | 16% |
5.5 times less than Lemon
|
| Carbs | 14g | 5% | 42% |
1.9 times less than Rice
|
| Net carbs | 12g | N/A | 43% |
4.5 times less than Chocolate
|
| Cholesterol | 0mg | 0% | 100% |
N/A
|
| Vitamin D* | 0 IU | 0% | 100% |
N/A
|
| Vitamin D | 0µg | 0% | 100% |
N/A
|
| Magnesium | 6mg | 1% | 82% |
23.3 times less than Almonds
|
| Calcium | 6mg | 1% | 85% |
20.8 times less than Milk
|
| Potassium | 77mg | 2% | 83% |
1.9 times less than Cucumber
|
| Iron | 0.28mg | 4% | 85% |
9.3 times less than Beef broiled
|
| Sugar | 10g | N/A | 19% |
1.1 times more than Coca-Cola
|
| Fiber | 2.4g | 10% | 26% |
Equal to Orange
|
| Copper | 0.06mg | 6% | 63% |
2.5 times less than Shiitake
|
| Zinc | 0.16mg | 1% | 80% |
39.4 times less than Beef broiled
|
| Starch | 0.03g | 0% | 11% |
509.7 times less than Potato
|
| Phosphorus | 12mg | 2% | 86% |
15.2 times less than Chicken meat
|
| Sodium | 1mg | 0% | 97% |
490 times less than White bread
|
| Vitamin E | 0.57mg | 4% | 22% |
2.6 times less than Kiwi
|
| Manganese | 0.34mg | 15% | 19% | |
| Selenium | 0.1µg | 0% | 77% | |
| Vitamin B1 | 0.04mg | 3% | 72% |
7.2 times less than Pea raw
|
| Vitamin B2 | 0.04mg | 3% | 77% |
3.2 times less than Avocado
|
| Vitamin B3 | 0.42mg | 3% | 74% |
22.9 times less than Turkey meat
|
| Vitamin B5 | 0.12mg | 2% | 62% |
9.1 times less than Sunflower seeds
|
| Vitamin B6 | 0.05mg | 4% | 68% |
2.3 times less than Oats
|
| Vitamin B12 | 0µg | 0% | 100% |
N/A
|
| Vitamin K | 19µg | 16% | 7% |
5.3 times less than Broccoli
|
| Folate | 6µg | 2% | 62% |
10.2 times less than Brussels sprouts
|
| Trans fat | 0g | N/A | 100% |
N/A
|
| Saturated fat | 0.03g | 0% | 86% |
210.5 times less than Beef broiled
|
| Choline | 6mg | 1% | 45% | |
| Monounsaturated fat | 0.05g | N/A | 78% |
208.5 times less than Avocado
|
| Polyunsaturated fat | 0.15g | N/A | 75% |
323.1 times less than Walnut
|
| Tryptophan | 0mg | 0% | 57% |
101.7 times less than Chicken meat
|
| Threonine | 0.02mg | 0% | 56% |
36 times less than Beef broiled
|
| Isoleucine | 0.02mg | 0% | 56% |
39.7 times less than Salmon raw
|
| Leucine | 0.04mg | 0% | 55% |
55.3 times less than Tuna Bluefin
|
| Lysine | 0.01mg | 0% | 57% |
34.8 times less than Tofu
|
| Methionine | 0.01mg | 0% | 54% |
8 times less than Quinoa
|
| Phenylalanine | 0.03mg | 0% | 55% |
25.7 times less than Egg
|
| Valine | 0.03mg | 0% | 55% |
65.5 times less than Soybean raw
|
| Histidine | 0.01mg | 0% | 56% |
68.1 times less than Turkey meat
|
| Fructose | 5g | 6% | 2% |
1.2 times less than Apple
|
| Caffeine | 0mg | 0% | 100% | |
| Omega-3 - EPA | 0g | N/A | 100% |
N/A
|
| Omega-3 - DHA | 0g | N/A | 100% |
N/A
|
| Omega-3 - DPA | 0g | N/A | 100% |
N/A
|
Check out similar food or compare with current
NUTRITION FACTS LABEL
Serving Size ______________
Health checks
Blueberry nutrition infographic
References
All the values for which the sources are not specified explicitly are taken from FDA’s Food Central. The exact link to the food presented on this page can be found below.