Chicken soup vs. New England Clam Chowder — In-Depth Nutrition Comparison
Compare
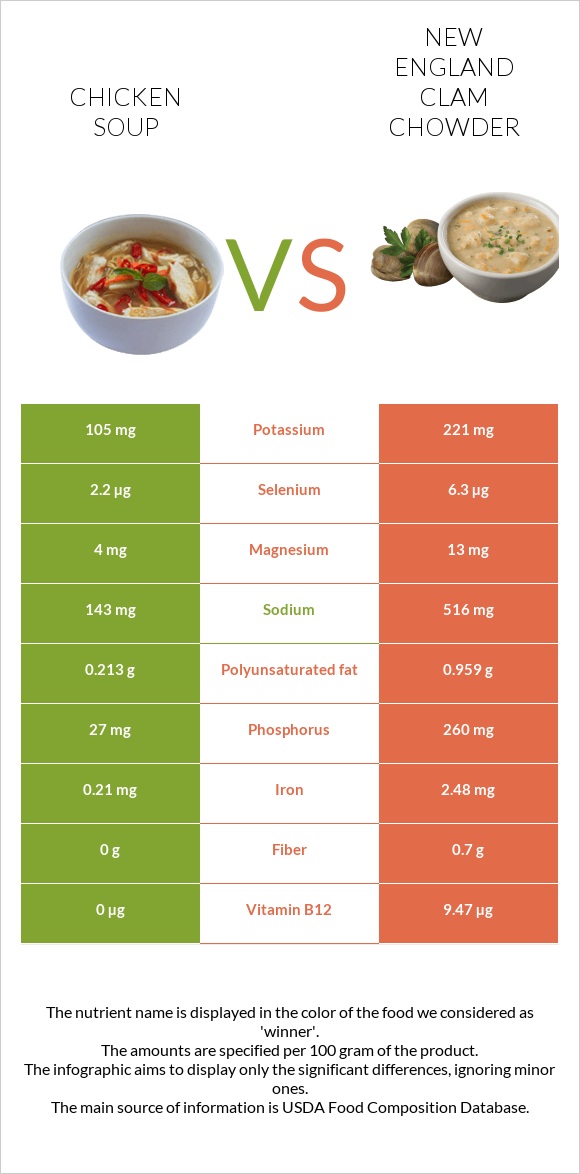
Important differences between Chicken soup and New England Clam Chowder
- New England Clam Chowder has more Vitamin B12, Phosphorus, Iron, Copper, Vitamin B1, Selenium, and Vitamin B2 than Chicken soup.
- New England Clam Chowder's daily need coverage for Vitamin B12 is 395% more.
- Chicken soup contains less Sodium.
The food varieties used in the comparison are Soup, stock, chicken, home-prepared and Soup, clam chowder, new england, canned, condensed.
Infographic
Infographic link
Mineral Comparison
Mineral comparison score is based on the number of minerals by which one or the other food is richer. The "coverage" charts below show how much of the daily needs can be covered by 300 grams of the food.
Contains
less
Sodium
-72.3%
Contains
more
Calcium
+433.3%
Contains
more
Iron
+1081%
Contains
more
Magnesium
+225%
Contains
more
Phosphorus
+863%
Contains
more
Potassium
+110.5%
Contains
more
Zinc
+164.3%
Contains
more
Copper
+342.6%
Contains
more
Selenium
+186.4%
Contains
less
Sodium
-72.3%
Contains
more
Calcium
+433.3%
Contains
more
Iron
+1081%
Contains
more
Magnesium
+225%
Contains
more
Phosphorus
+863%
Contains
more
Potassium
+110.5%
Contains
more
Zinc
+164.3%
Contains
more
Copper
+342.6%
Contains
more
Selenium
+186.4%
Vitamin Comparison
Vitamin comparison score is based on the number of vitamins by which one or the other food is richer. The "coverage" charts below show how much of the daily needs can be covered by 300 grams of the food.
:
Contains
more
Vitamin A
+1833.3%
Contains
more
Vitamin E
+1300%
Contains
more
Vitamin C
+1950%
Contains
more
Vitamin B1
+257.1%
Contains
more
Vitamin B2
+94.1%
Contains
more
Vitamin B6
+70.5%
Contains
more
Folate
+180%
Contains
more
Vitamin B12
+∞%
Contains
more
Vitamin K
+300%
Equal in Vitamin B3 - 1.55
Contains
more
Vitamin A
+1833.3%
Contains
more
Vitamin E
+1300%
Contains
more
Vitamin C
+1950%
Contains
more
Vitamin B1
+257.1%
Contains
more
Vitamin B2
+94.1%
Contains
more
Vitamin B6
+70.5%
Contains
more
Folate
+180%
Contains
more
Vitamin B12
+∞%
Contains
more
Vitamin K
+300%
Equal in Vitamin B3 - 1.55
Macronutrient Comparison
Macronutrient breakdown side-by-side comparison
Contains
more
Water
+13.1%
Contains
more
Protein
+25.8%
Contains
more
Fats
+71.7%
Contains
more
Carbs
+192.4%
Contains
more
Other
+393.3%
Protein:
2.52 g
Fats:
1.2 g
Carbs:
3.53 g
Water:
92.15 g
Other:
0.6 g
Protein:
3.17 g
Fats:
2.06 g
Carbs:
10.32 g
Water:
81.49 g
Other:
2.96 g
Contains
more
Water
+13.1%
Contains
more
Protein
+25.8%
Contains
more
Fats
+71.7%
Contains
more
Carbs
+192.4%
Contains
more
Other
+393.3%
Fat Type Comparison
Fat type breakdown side-by-side comparison
Contains
less
Saturated Fat
-66.5%
Contains
more
Monounsaturated Fat
+∞%
Contains
more
Polyunsaturated fat
+350.2%
Saturated Fat:
0.321 g
Monounsaturated Fat:
0.582 g
Polyunsaturated fat:
0.213 g
Saturated Fat:
0.959 g
Monounsaturated Fat:
0 g
Polyunsaturated fat:
0.959 g
Contains
less
Saturated Fat
-66.5%
Contains
more
Monounsaturated Fat
+∞%
Contains
more
Polyunsaturated fat
+350.2%
Comparison summary table
Pay attention to the rightmost column. It displays the amounts side by side, giving a clearer understanding of the difference.
 |
 |
||
| Lower in Sugar |
|
||
| Lower in Glycemic Index |
|
||
| Rich in minerals |
|
||
| Rich in vitamins |
|
||
| Lower in Sodium |
|
||
| Lower in Cholesterol |
|
||
| Lower in Saturated Fat |
|
||
| Lower in price | Equal | ||
All nutrients comparison - raw data values
| Nutrient | |
|
Opinion |
| Net carbs | 3.53g | 9.62g |
|
| Protein | 2.52g | 3.17g |
|
| Fats | 1.2g | 2.06g |
|
| Carbs | 3.53g | 10.32g |
|
| Calories | 36kcal | 72kcal |
|
| Sugar | 1.58g | 0.38g |
|
| Fiber | 0g | 0.7g |
|
| Calcium | 3mg | 16mg |
|
| Iron | 0.21mg | 2.48mg |
|
| Magnesium | 4mg | 13mg |
|
| Phosphorus | 27mg | 260mg |
|
| Potassium | 105mg | 221mg |
|
| Sodium | 143mg | 516mg |
|
| Zinc | 0.14mg | 0.37mg |
|
| Copper | 0.054mg | 0.239mg |
|
| Manganese | 0.165mg |
|
|
| Selenium | 2.2µg | 6.3µg |
|
| Vitamin A | 3IU | 58IU |
|
| Vitamin A RAE | 1µg | 17µg |
|
| Vitamin E | 0.03mg | 0.42mg |
|
| Vitamin C | 0.2mg | 4.1mg |
|
| Vitamin B1 | 0.035mg | 0.125mg |
|
| Vitamin B2 | 0.085mg | 0.165mg |
|
| Vitamin B3 | 1.584mg | 1.55mg |
|
| Vitamin B5 | 0.231mg |
|
|
| Vitamin B6 | 0.061mg | 0.104mg |
|
| Folate | 5µg | 14µg |
|
| Vitamin B12 | 0µg | 9.47µg |
|
| Vitamin K | 0.2µg | 0.8µg |
|
| Cholesterol | 3mg | 6mg |
|
| Trans Fat | 0.013g |
|
|
| Saturated Fat | 0.321g | 0.959g |
|
| Omega-3 - DHA | 0g | 0.011g |
|
| Omega-3 - EPA | 0g | 0.01g |
|
| Omega-3 - DPA | 0g | 0.008g |
|
| Monounsaturated Fat | 0.582g | 0g |
|
| Polyunsaturated fat | 0.213g | 0.959g |
|
Which food is preferable for your diet?
is better in case of low diet
|
|
|
| Low Fats diet |
|
|
| Low Carbs diet |
|
|
| Low Calories diet |
|
|
| Low Glycemic Index diet |
|
People also compare


Vitamins & Minerals Daily Need Coverage Score
The summary scores indicate the extent to which this food can fulfill your daily vitamin and mineral requirements if you consume 3 servings, consisting of 100 grams of each (an approximation of 3 serving sizes).
Vitamins Daily Need Coverage Score
6%
113%
Minerals Daily Need Coverage Score
8%
45%
Comparison summary
Which food is lower in Sugar?
New England Clam Chowder is lower in Sugar (difference - 1.2g)
Which food is lower in glycemic index?
New England Clam Chowder is lower in glycemic index (difference - 52)
Which food is richer in minerals?
New England Clam Chowder is relatively richer in minerals
Which food is richer in vitamins?
New England Clam Chowder is relatively richer in vitamins
Which food contains less Sodium?
Chicken soup contains less Sodium (difference - 373mg)
Which food is lower in Cholesterol?
Chicken soup is lower in Cholesterol (difference - 3mg)
Which food is lower in Saturated Fat?
Chicken soup is lower in Saturated Fat (difference - 0.638g)
Which food is cheaper?
?
The foods are relatively equal in price ($)