Dates nutrition: calories, carbs, GI, protein, fiber, fats

Carbs in Dates
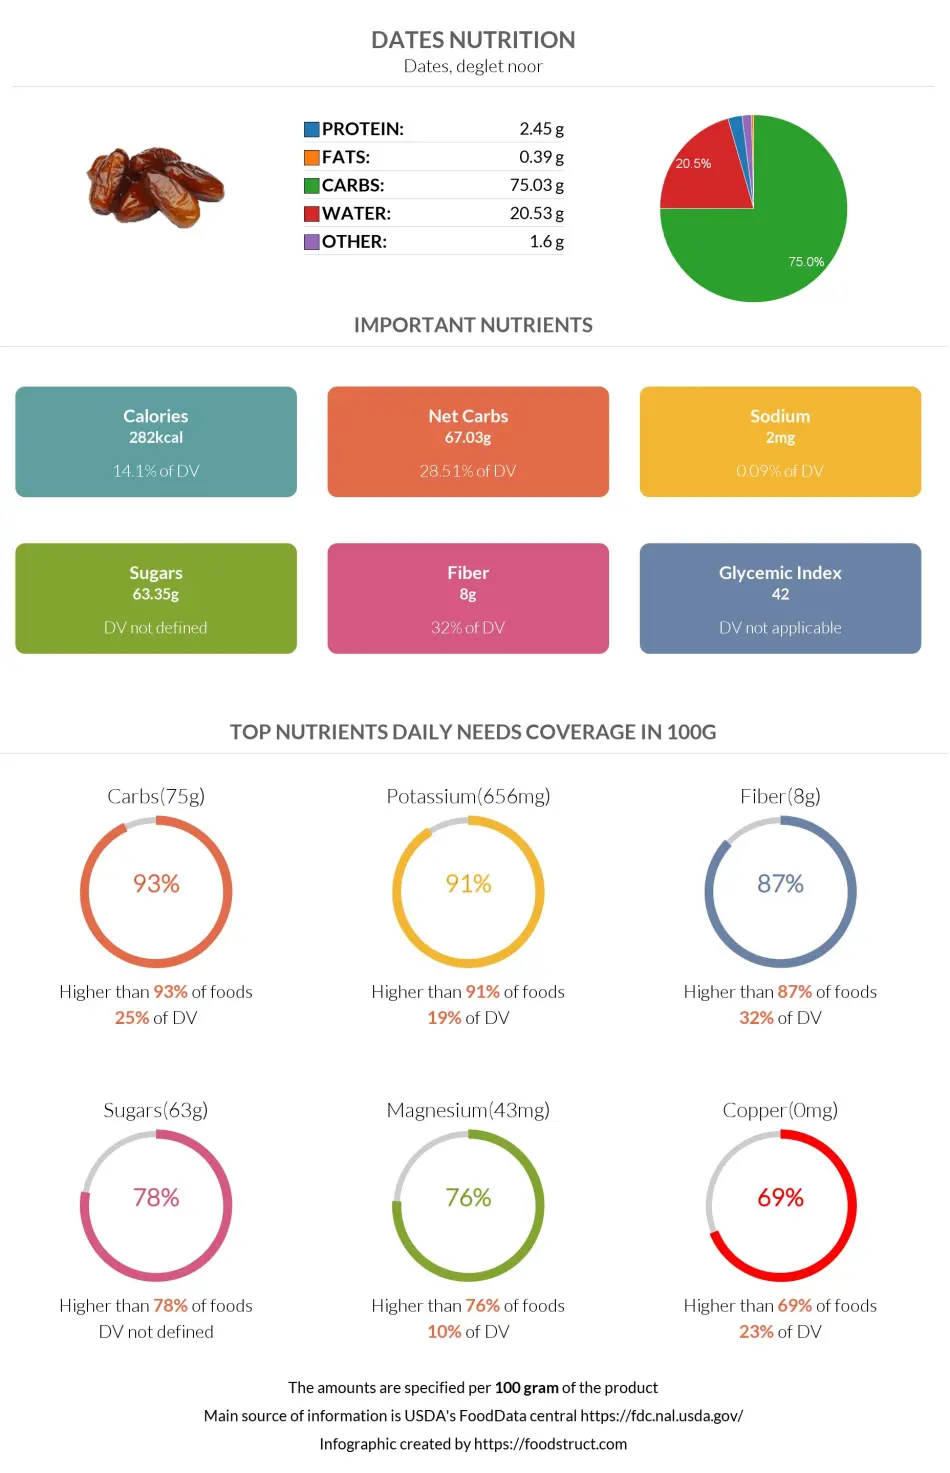
Among all nutrients, carbohydrates are the highest one presented dates.
The total carbohydrates in 100g of dates are 75g. This means that dates contain very high amounts of carbs.
In the chart below, we can visualize the total carbohydrate distribution of other macronutrients and water.
Macronutrients chart
Carbs per serving size
The serving size of dates is 7.1g, equivalent to one average-sized date. The total carbohydrate in one serving of dates is 5.3g.
Furthermore, the net carbs in 1 serving are equal to 4.75g.
Carbohydrate type breakdown
The carbohydrates in dates are equally distributed among glucose, sucrose, and fructose. It is noticeable that starch is absent in the carbohydrate composition of dates. The difference is that glucose, sucrose, and fructose are simple sugars readily taken into the system, whereas starch takes time to break down. This is an essential factor in increasing blood sugar and the occurrence of insulin spikes.
In this chart, we can see the distribution among different sugars.
Carbohydrate type breakdown
Net carbs in dates
The net carbs in 100g dates are equal to 67g. Dates are high in carbohydrates, and they have to be considered. They are commonly used during fasting and usually make energy shakes for workouts due to their high carb content.
Fiber in dates
Per 100g of dates, there are 8g of fiber. This satisfies 32% of the daily recommended value for fiber.
When considering one serving equivalent to 7.1g, there is 0.57g of fiber.
According to the study, one cup of dried dates, which equals 175g, contains 1.69g of soluble fiber, meaning the rest is insoluble fiber (1).
Fiber content ratio for Dates
Comparison to other foods
The table below compares dates to similar foods, taking the carbohydrate content as a variable.
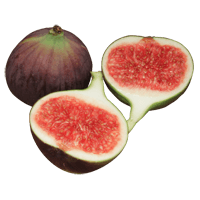
Dates are commonly compared to dried fruits like figs, raisins, and cranberries.
This article compares dates and figs, considering the macros, vitamins, minerals, and health impacts.
| Food | Carbohydrates (per serving) | Carbohydrates per 100g |
| Dates | 5.3g (7.1g) | 75g |
| Dried apricots | 2.2g (3.5g) | 62.6g |
| Raisins | 20.5g (26g) | 79.2g |
| Cranberry | 12.3g (110g) | 11.2g |
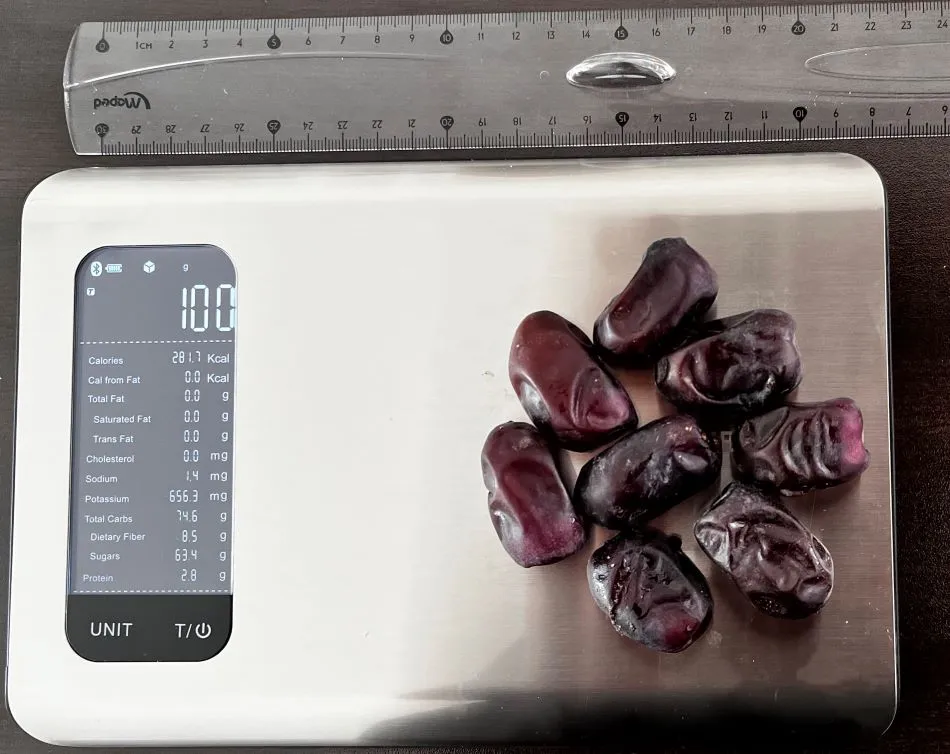
What Do 282 Calories or 100 Grams of Dates Look Like?
The photo below represents what 100 grams of dates look like to help you visualize their weight and calories.
According to our calculations, about 8 middle-sized dates comprised 100 grams or 282 calories, which means one date fruit is approximately 12.5 grams or 35.25 calories.
References

Important nutritional characteristics for Dates
|
Glycemic index ⓘ
Source:
Check out our Glycemic index chart page for the full list.
|
42 (low) |
| Glycemic load | 2 (low) |
| Insulin index ⓘ https://www.researchgate.net/publication/256665818 | 64 |
| Calories ⓘ Calories per 100-gram serving | 282 |
| Net Carbs ⓘ Net Carbs = Total Carbohydrates – Fiber – Sugar Alcohols | 67.03 grams |
| Serving Size ⓘ Serving sizes are taken from FDA's Reference Amounts Customarily Consumed (RACCs) | 1 date, pitted (7.1 grams) |
| Acidity (Based on PRAL) ⓘ PRAL (Potential renal acid load) is calculated using a formula. On the PRAL scale the higher the positive value, the more is the acidifying effect on the body. The lower the negative value, the higher the alkalinity of the food. 0 is neutral. | -11.9 (alkaline) |
| Oxalates ⓘ https://www.jetir.org/papers/JETIR1804445.pdf | 62mg |
Dates calories (kcal)
| Serving Size | Calories | Weight |
|---|---|---|
| Calories in 100 grams | 282 | |
| Calories in 1 cup, chopped | 415 | 147 g |
| Calories in 1 date, pitted | 20 | 7.1 g |
Dates Glycemic index (GI)
Dates Glycemic load (GL)
Mineral coverage chart
Mineral chart - relative view
Vitamin coverage chart
Vitamin chart - relative view
Protein quality breakdown
Fat type information
All nutrients for Dates per 100g
| Nutrient | Value | DV% | In TOP % of foods | Comparison |
| Calories | 282kcal | 14% | 32% |
6 times more than Orange
|
| Protein | 2.45g | 6% | 74% |
1.2 times less than Broccoli
|
| Fats | 0.39g | 1% | 83% |
85.4 times less than Cheddar Cheese
|
| Vitamin C | 0.4mg | 0% | 48% |
132.5 times less than Lemon
|
| Net carbs | 67.03g | N/A | 9% |
1.2 times more than Chocolate
|
| Carbs | 75.03g | 25% | 7% |
2.7 times more than Rice
|
| Cholesterol | 0mg | 0% | 100% |
N/A
|
| Vitamin D | 0µg | 0% | 100% |
N/A
|
| Iron | 1.02mg | 13% | 59% |
2.5 times less than Beef broiled
|
| Calcium | 39mg | 4% | 38% |
3.2 times less than Milk
|
| Potassium | 656mg | 19% | 9% |
4.5 times more than Cucumber
|
| Magnesium | 43mg | 10% | 24% |
3.3 times less than Almond
|
| Sugar | 63.35g | N/A | 22% |
7.1 times more than Coca-Cola
|
| Fiber | 8g | 32% | 13% |
3.3 times more than Orange
|
| Copper | 0.21mg | 23% | 31% |
1.5 times more than Shiitake
|
| Zinc | 0.29mg | 3% | 80% |
21.8 times less than Beef broiled
|
| Phosphorus | 62mg | 9% | 74% |
2.9 times less than Chicken meat
|
| Sodium | 2mg | 0% | 96% |
245 times less than White Bread
|
| Vitamin A | 10IU | 0% | 64% |
1670.6 times less than Carrot
|
| Vitamin A RAE | 0µg | 0% | 100% | |
| Vitamin E | 0.05mg | 0% | 91% |
29.2 times less than Kiwifruit
|
| Selenium | 3µg | 5% | 72% | |
| Manganese | 0.26mg | 11% | 47% | |
| Vitamin B1 | 0.05mg | 4% | 71% |
5.1 times less than Pea raw
|
| Vitamin B2 | 0.07mg | 5% | 76% |
2 times less than Avocado
|
| Vitamin B3 | 1.27mg | 8% | 65% |
7.5 times less than Turkey meat
|
| Vitamin B5 | 0.59mg | 12% | 53% |
1.9 times less than Sunflower seed
|
| Vitamin B6 | 0.17mg | 13% | 53% |
1.4 times more than Oat
|
| Vitamin B12 | 0µg | 0% | 100% |
N/A
|
| Vitamin K | 2.7µg | 2% | 61% |
37.6 times less than Broccoli
|
| Folate | 19µg | 5% | 49% |
3.2 times less than Brussels sprout
|
| Trans Fat | 0g | N/A | 100% |
N/A
|
| Saturated Fat | 0.03g | 0% | 88% |
184.2 times less than Beef broiled
|
| Monounsaturated Fat | 0.04g | N/A | 86% |
272.2 times less than Avocado
|
| Polyunsaturated fat | 0.02g | N/A | 94% |
2482.8 times less than Walnut
|
| Tryptophan | 0.01mg | 0% | 95% |
25.4 times less than Chicken meat
|
| Threonine | 0.04mg | 0% | 94% |
16.7 times less than Beef broiled
|
| Isoleucine | 0.05mg | 0% | 94% |
18.7 times less than Salmon raw
|
| Leucine | 0.08mg | 0% | 94% |
28.9 times less than Tuna Bluefin
|
| Lysine | 0.07mg | 0% | 93% |
6.8 times less than Tofu
|
| Methionine | 0.02mg | 0% | 93% |
4.4 times less than Quinoa
|
| Phenylalanine | 0.05mg | 0% | 94% |
13.4 times less than Egg
|
| Valine | 0.07mg | 0% | 93% |
28.6 times less than Soybean raw
|
| Histidine | 0.03mg | 0% | 93% |
23.4 times less than Turkey meat
|
| Fructose | 19.56g | 24% | 80% |
3.3 times more than Apple
|
| Omega-3 - EPA | 0g | N/A | 100% |
N/A
|
| Omega-3 - DHA | 0g | N/A | 100% |
N/A
|
| Omega-3 - DPA | 0g | N/A | 100% |
N/A
|
| Omega-6 - Gamma-linoleic acid | 0g | N/A | 100% | |
| Omega-6 - Eicosadienoic acid | 0g | N/A | 100% |
Check out similar food or compare with current
NUTRITION FACTS LABEL
Serving Size ______________
Health checks
Dates nutrition infographic
References
All the values for which the sources are not specified explicitly are taken from FDA’s Food Central. The exact link to the food presented on this page can be found below.