
Сравнить продукты Вино Зинфандель и вино Санджовезе
Сравнить
Инфографика
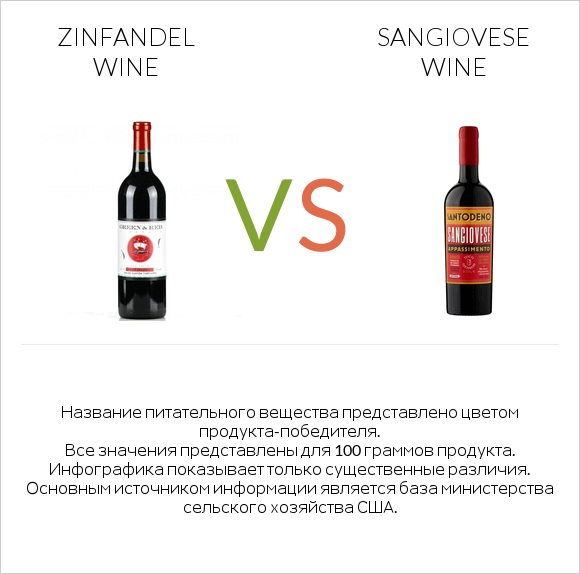
Infographic link
Сравнение минералов
The mineral comparison score is based on which food has a more favorable amount of each mineral. The �coverage� charts below show how much of the daily mineral needs are covered by the selected amount of each food.
Сравнение витаминов
The vitamin comparison score is based on the number of vitamins in which one food is richer than the other. The �coverage� charts below show how much of the daily vitamin needs are covered by the selected amount of each food.
Таблица сравнения всех элементов
| Nutrient |  |
 |
DV% diff. |
| Калорийность | 88kcal | 86kcal | 0% |
| Белки | 0.07g | 0.07g | 0% |
| Вес 100 калорий | 114g | 116g | N/A |
| Чистые углеводы | 2.86g | 2.62g | N/A |
| Углеводы | 2.86g | 2.62g | 0% |
Macronutrient Comparison
Macronutrient breakdown side-by-side comparison
Белки:
0.07 г
Жиры:
0 г
Углеводы:
2.86 г
Вода:
85.71 г
Другое:
11.36 г
Белки:
0.07 г
Жиры:
0 г
Углеводы:
2.62 г
Вода:
86.17 г
Другое:
11.14 г
Одинаковое количество вещества
Белки
~0.07g
Одинаковое количество вещества
Жиры
~0g
Одинаковое количество вещества
Углеводы
~2.62g
Одинаковое количество вещества
Вода
~86.17g

