
Beverages, THE COCA-COLA COMPANY, NOS energy drink, Original, grape, loaded cherry, charged citrus, fortified with vitamins B6 and B12 vs. Perrier — In-Depth Nutrition Comparison
Compare
The main differences between beverages, THE COCA-COLA COMPANY, NOS energy drink, Original, grape, loaded cherry, charged citrus, fortified with vitamins B6 and B12 and perrier
- Perrier contains less vitamin B12 and vitamin B6 than beverages, THE COCA-COLA COMPANY, NOS energy drink, Original, grape, loaded cherry, charged citrus, fortified with vitamins B6 and B12.
- Daily need coverage for vitamin B12 for beverages, THE COCA-COLA COMPANY, NOS energy drink, Original, grape, loaded cherry, charged citrus, fortified with vitamins B6 and B12 is 104% higher.
Food types used in this article are Beverages, THE COCA-COLA COMPANY, NOS energy drink, Original, grape, loaded cherry, charged citrus, fortified with vitamins B6 and B12 and Beverages, water, bottled, PERRIER.
Infographic
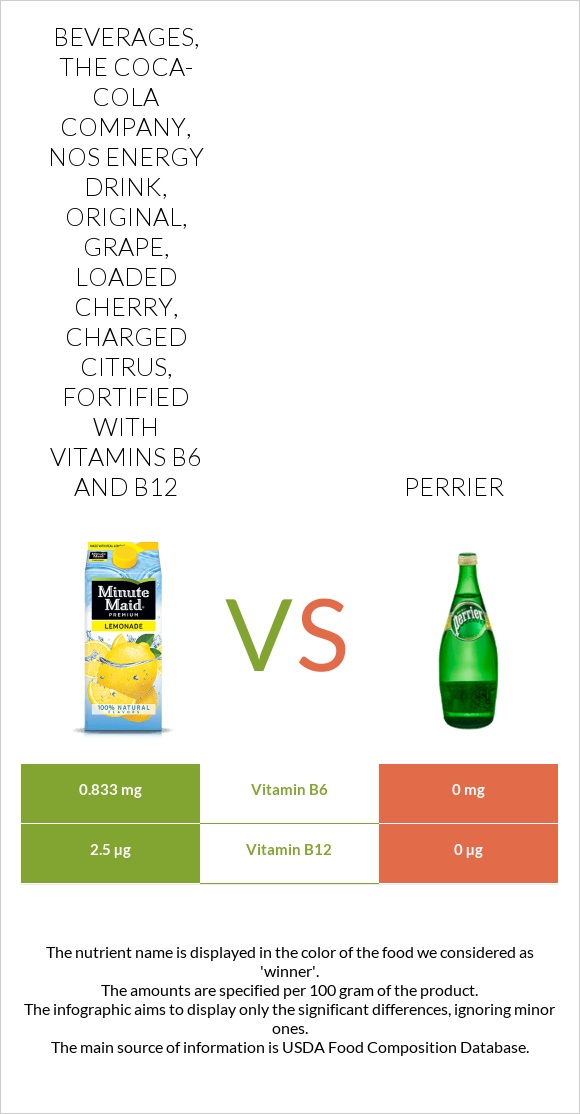
Infographic link
Mineral Comparison
The mineral comparison score is based on which food has a more favorable amount of each mineral. The �coverage� charts below show how much of the daily mineral needs are covered by the selected amount of each food.
| Contains more CalciumCalcium | +∞% |
| Contains less SodiumSodium | -98.8% |
Vitamin Comparison
The vitamin comparison score is based on the number of vitamins in which one food is richer than the other. The �coverage� charts below show how much of the daily vitamin needs are covered by the selected amount of each food.
| Contains more Vitamin B6Vitamin B6 | +∞% |
| Contains more Vitamin B12Vitamin B12 | +∞% |
All nutrients comparison - raw data values
| Nutrient |  |
 |
DV% diff. |
| Vitamin B12 | 2.5µg | 0µg | 104% |
| Vitamin B6 | 0.833mg | 0mg | 64% |
| Caffeine | 34mg | 9% | |
| Carbs | 11.25g | 0g | 4% |
| Sodium | 85mg | 1mg | 4% |
| Calories | 44kcal | 0kcal | 2% |
| Calcium | 0mg | 14mg | 1% |
| Weight per 100 calories | 227g | N/A | |
| Net carbs | 11.25g | 0g | N/A |
| Sugar | 11.25g | N/A |
Macronutrient Comparison
Macronutrient breakdown side-by-side comparison
Protein:
0 g
Fats:
0 g
Carbs:
11.25 g
Water:
88.45 g
Other:
0.3 g
Protein:
0 g
Fats:
0 g
Carbs:
0 g
Water:
99.9 g
Other:
0.1 g
| Contains more CarbsCarbs | +∞% |
| Contains more WaterWater | +12.9% |
~equal in
Protein
~0g
~equal in
Fats
~0g