Candies, MARS SNACKFOOD US, STARBURST Fruit Chews, Fruit and Creme vs. Taffy (candy) — In-Depth Nutrition Comparison
Compare
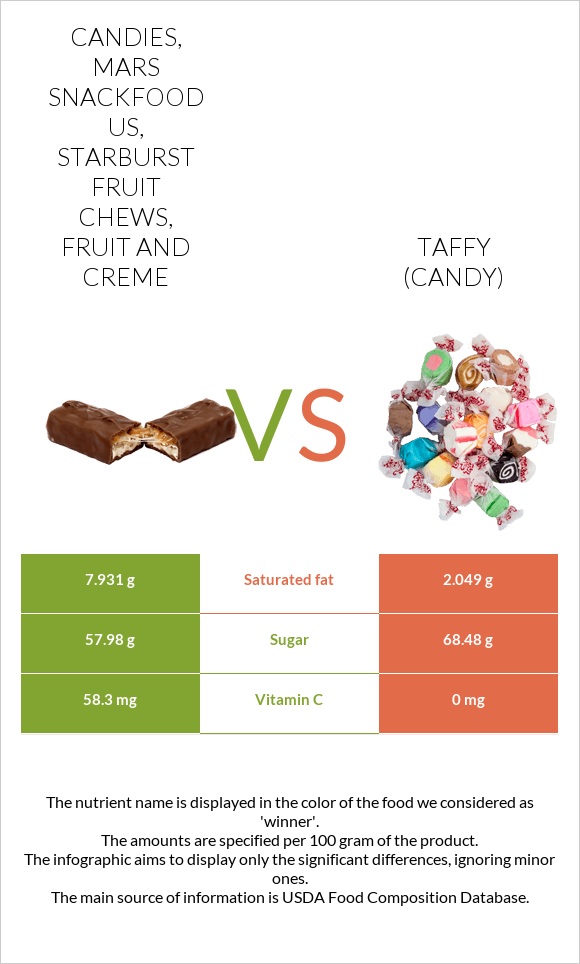
Differences between candies, MARS SNACKFOOD US, STARBURST Fruit Chews, Fruit and Creme and taffy (candy)
- Taffy (candy) contains less vitamin C than candies, MARS SNACKFOOD US, STARBURST Fruit Chews, Fruit, and Creme.
- Candies, MARS SNACKFOOD US, STARBURST Fruit Chews, Fruit, and Creme's daily need coverage for vitamin C is 65% higher.
- Taffy (candy) contains 4 times less saturated fat than candies, MARS SNACKFOOD US, STARBURST Fruit Chews, Fruit, and Creme. Candies, MARS SNACKFOOD US, STARBURST Fruit Chews, Fruit, and Creme contains 7.931g of saturated fat, while taffy (candy) contains 2.049g.
The food types used in this comparison are Candies, MARS SNACKFOOD US, STARBURST Fruit Chews, Fruit, and Creme and Candies, taffy, prepared-from-recipe.
Infographic
Infographic link
Mineral Comparison
Mineral comparison score is based on the number of minerals by which one or the other food is richer. The "coverage" charts below show how much of the daily needs can be covered by 300 grams of the food.
| Contains less SodiumSodium | -96.2% |
| Contains more CalciumCalcium | +∞% |
Vitamin Comparison
Vitamin comparison score is based on the number of vitamins by which one or the other food is richer. The "coverage" charts below show how much of the daily needs can be covered by 300 grams of the food.
| Contains more Vitamin CVitamin C | +∞% |
| Contains more Vitamin AVitamin A | +∞% |
All nutrients comparison - raw data values
| Nutrient |  |
 |
DV% diff. |
| Vitamin C | 58.3mg | 0mg | 65% |
| Saturated fat | 7.931g | 2.049g | 27% |
| Fats | 8.36g | 3.33g | 8% |
| Carbs | 82.43g | 91.56g | 3% |
| Cholesterol | 0mg | 9mg | 3% |
| Vitamin A | 0µg | 27µg | 3% |
| Zinc | 0.21mg | 2% | |
| Sodium | 2mg | 52mg | 2% |
| Vitamin B1 | 0.028mg | 2% | |
| Monounsaturated fat | 0.838g | 2% | |
| Calories | 408kcal | 397kcal | 1% |
| Protein | 0.41g | 0.03g | 1% |
| Calcium | 0mg | 8mg | 1% |
| Vitamin E | 0.09mg | 1% | |
| Selenium | 0.7µg | 1% | |
| Vitamin B2 | 0.012mg | 1% | |
| Polyunsaturated fat | 0.121g | 1% | |
| Weight per 100 calories | 25g | 25g | N/A |
| Unsaturated / Saturated Fat ratio | 0 | 0.47 | N/A |
| Net carbs | 82.43g | 91.56g | N/A |
| Potassium | 3mg | 0% | |
| Iron | 0.01mg | 0.01mg | 0% |
| Sugar | 57.98g | 68.48g | N/A |
| Phosphorus | 1mg | 0% | |
| Vitamin B3 | 0.002mg | 0% | |
| Vitamin B5 | 0.004mg | 0% | |
| Vitamin B12 | 0.01µg | 0% | |
| Vitamin K | 0.3µg | 0% | |
| Trans fat | 0.141g | 0.131g | N/A |
| Omega-3 - ALA | 0.013g | N/A | |
| Omega-6 - Linoleic acid | 0.086g | N/A |
Macronutrient Comparison
Macronutrient breakdown side-by-side comparison
Protein:
0.41 g
Fats:
8.36 g
Carbs:
82.43 g
Water:
8.7 g
Other:
0.1 g
Protein:
0.03 g
Fats:
3.33 g
Carbs:
91.56 g
Water:
4.85 g
Other:
0.23 g
| Contains more ProteinProtein | +1266.7% |
| Contains more FatsFats | +151.1% |
| Contains more WaterWater | +79.4% |
| Contains more CarbsCarbs | +11.1% |
| Contains more OtherOther | +130% |
Fat Type Comparison
Fat type breakdown side-by-side comparison
Saturated fat:
Sat. Fat
7.931 g
Monounsaturated fat:
Mono. Fat
0 g
Polyunsaturated fat:
Poly. Fat
0 g
Saturated fat:
Sat. Fat
2.049 g
Monounsaturated fat:
Mono. Fat
0.838 g
Polyunsaturated fat:
Poly. Fat
0.121 g
| Contains less Sat. FatSaturated fat | -74.2% |