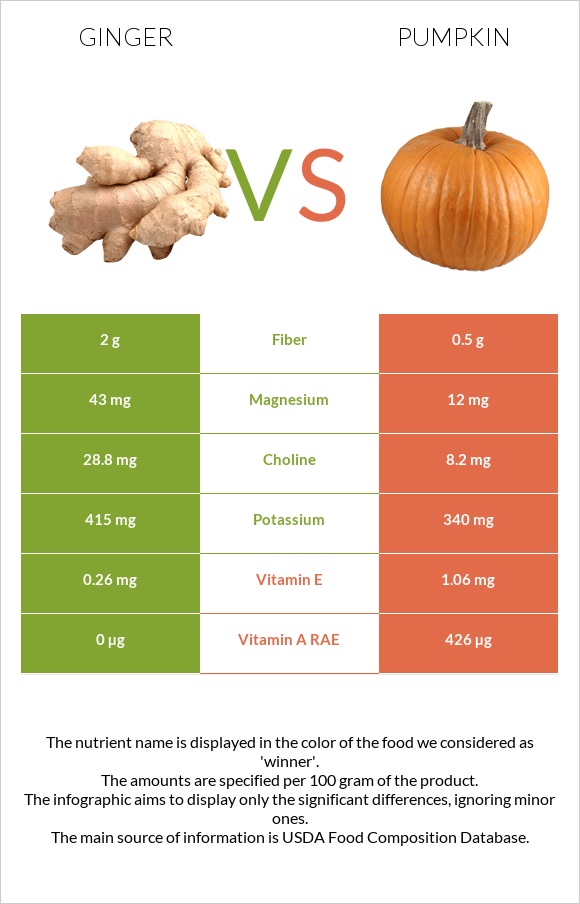
How are ginger and pumpkin different? Ginger is richer in copper, vitamin B6, magnesium, and fiber, while pumpkin is higher in vitamin A, vitamin B2, and vitamin E. Pumpkin covers your daily need for vitamin A, 170% more than ginger. Ginger contains 4 times more fiber than pumpkin. Ginger contains 2g of fiber, while pumpkin contains 0.5g. Pumpkin has a higher glycemic index (52) than ginger (10). Ginger root, raw and Pumpkin, raw types were used in this article.
Infographic
Mineral Comparison
Mineral comparison score is based on the number of minerals by which one or the other food is richer. The "coverage" charts below show how much of the daily needs can be covered by 300 grams of the food.
5
100 g
300 g
1 tsp - 2g 5 slices (1" dia) - 11g 0.25 cup slices (1" dia) - 24g
Magnesium
Magnesium
Calcium
Calcium
Potassium
Potassium
Iron
Iron
Copper
Copper
Zinc
Zinc
Phosphorus
Phosphorus
Sodium
Sodium
Manganese
Manganese
Selenium
Selenium
31%
4.8%
37%
23%
75%
9.3%
15%
1.7%
30%
3.8%
4
100 g
300 g
1 cup (1" cubes) - 116g
Magnesium
Magnesium
Calcium
Calcium
Potassium
Potassium
Iron
Iron
Copper
Copper
Zinc
Zinc
Phosphorus
Phosphorus
Sodium
Sodium
Manganese
Manganese
Selenium
Selenium
8.6%
6.3%
30%
30%
42%
8.7%
19%
0.13%
16%
1.6%
Vitamin Comparison
Vitamin comparison score is based on the number of vitamins by which one or the other food is richer. The "coverage" charts below show how much of the daily needs can be covered by 300 grams of the food.
2
100 g
300 g
1 tsp - 2g 5 slices (1" dia) - 11g 0.25 cup slices (1" dia) - 24g
Vitamin C
Vit. C
Vitamin D
Vit. D
Vitamin A
Vit. A
Vitamin E
Vit. E
Vitamin B1
Vit. B1
Vitamin B2
Vit. B2
Vitamin B3
Vit. B3
Vitamin B5
Vit. B5
Vitamin B6
Vit. B6
Vitamin B12
Vit. B12
Vitamin K
Vit. K
Folate
Folate
17%
0%
0%
5.2%
6.3%
7.8%
14%
12%
37%
0%
0.25%
8.3%
8
100 g
300 g
1 cup (1" cubes) - 116g
Vitamin C
Vit. C
Vitamin D
Vit. D
Vitamin A
Vit. A
Vitamin E
Vit. E
Vitamin B1
Vit. B1
Vitamin B2
Vit. B2
Vitamin B3
Vit. B3
Vitamin B5
Vit. B5
Vitamin B6
Vit. B6
Vitamin B12
Vit. B12
Vitamin K
Vit. K
Folate
Folate
30%
0%
142%
21%
13%
25%
11%
18%
14%
0%
2.8%
12%
All nutrients comparison - raw data values
Nutrient
DV% diff.
Vitamin A
0µg
426µg
47%
Copper
0.226mg
0.127mg
11%
Vitamin B6
0.16mg
0.061mg
8%
Magnesium
43mg
12mg
7%
Fiber
2g
0.5g
6%
Vitamin B2
0.034mg
0.11mg
6%
Vitamin E
0.26mg
1.06mg
5%
Manganese
0.229mg
0.125mg
5%
Vitamin C
5mg
9mg
4%
Carbs
17.77g
6.5g
4%
Choline
28.8mg
8.2mg
4%
Calories
80kcal
26kcal
3%
Iron
0.6mg
0.8mg
3%
Protein
1.82g
1g
2%
Potassium
415mg
340mg
2%
Vitamin B1
0.025mg
0.05mg
2%
Vitamin B5
0.203mg
0.298mg
2%
Fats
0.75g
0.1g
1%
Calcium
16mg
21mg
1%
Phosphorus
34mg
44mg
1%
Sodium
13mg
1mg
1%
Selenium
0.7µg
0.3µg
1%
Vitamin B3
0.75mg
0.6mg
1%
Vitamin K
0.1µg
1.1µg
1%
Folate
11µg
16µg
1%
Saturated fat
0.203g
0.052g
1%
Polyunsaturated fat
0.154g
0.005g
1%
Protein per 100 calories
2.3g
3.8g
N/A
Calories per 10 g protein
440kcal
260kcal
N/A
Weight per 100 calories
125g
385g
N/A
Net carbs
15.77g
6g
N/A
Sugar
1.7g
2.76g
N/A
Zinc
0.34mg
0.32mg
0%
Monounsaturated fat
0.154g
0.013g
0%
Tryptophan
0.012mg
0.012mg
0%
Threonine
0.036mg
0.029mg
0%
Isoleucine
0.051mg
0.031mg
0%
Leucine
0.074mg
0.046mg
0%
Lysine
0.057mg
0.054mg
0%
Methionine
0.013mg
0.011mg
0%
Phenylalanine
0.045mg
0.032mg
0%
Valine
0.073mg
0.035mg
0%
Histidine
0.03mg
0.016mg
0%
Macronutrient Comparison
Macronutrient breakdown side-by-side comparison
3
2%
18%
79%
Protein:
1.82 g
Fats:
0.75 g
Carbs:
17.77 g
Water:
78.89 g
Other:
0.77 g
2
7%
92%
Protein:
1 g
Fats:
0.1 g
Carbs:
6.5 g
Water:
91.6 g
Other:
0.8 g
Contains
more
Protein Protein
+82%
Contains
more
Fats Fats
+650%
Contains
more
Carbs Carbs
+173.4%
Contains
more
Water Water
+16.1%
Fat Type Comparison
Fat type breakdown side-by-side comparison
2
40%
30%
30%
Saturated fat:
Sat. Fat
0.203 g
Monounsaturated fat:
Mono. Fat
0.154 g
Polyunsaturated fat:
Poly. Fat
0.154 g
1
74%
19%
7%
Saturated fat:
Sat. Fat
0.052 g
Monounsaturated fat:
Mono. Fat
0.013 g
Polyunsaturated fat:
Poly. Fat
0.005 g
Contains
more
Mono. Fat Monounsaturated fat
+1084.6%
Contains
more
Poly. Fat Polyunsaturated fat
+2980%
Contains
less
Sat. Fat Saturated fat
-74.4%