Spinach raw vs. Kiwi — In-Depth Nutrition Comparison
Compare
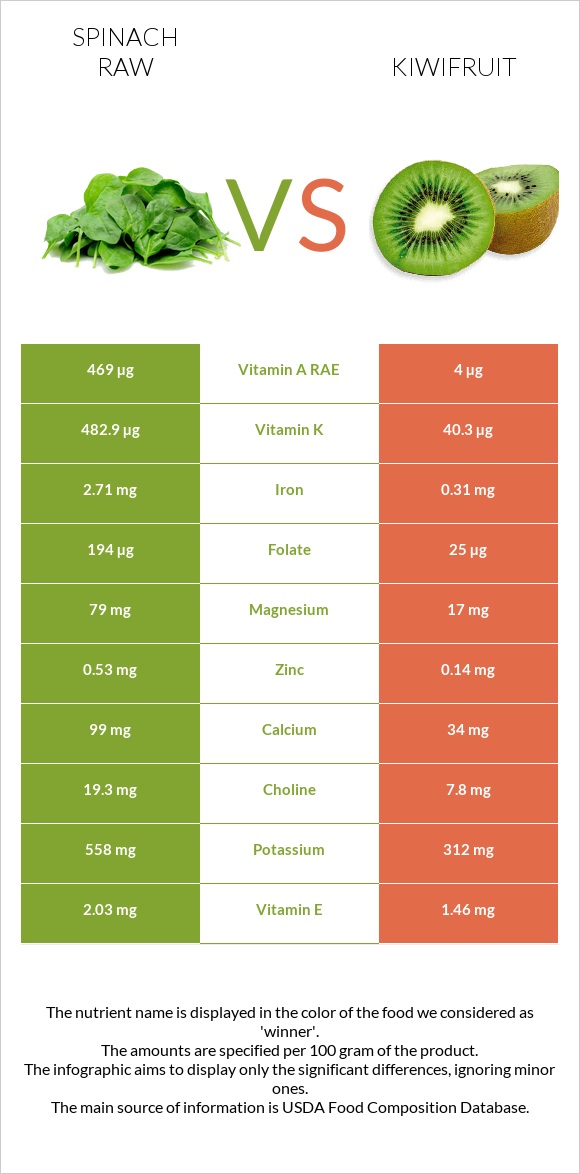
A recap on the differences between spinach raw and kiwi
- Spinach raw is higher in vitamin K, vitamin A, folate, manganese, iron, magnesium, vitamin B2, vitamin B6, and potassium, yet kiwi is higher in vitamin C.
- Spinach raw covers your daily vitamin K needs 369% more than kiwi.
- Spinach raw contains 108 times more vitamin A than kiwi. While spinach raw contains 9377 IU of vitamin A, kiwi contains only 87 IU.
- The glycemic index of spinach raw is lower.
Food varieties used in this article are Spinach, raw and Kiwifruit, green, raw.
Infographic
Infographic link
Mineral Comparison
Mineral comparison score is based on the number of minerals by which one or the other food is richer. The "coverage" charts below show how much of the daily needs can be covered by 300 grams of the food.
| Contains more MagnesiumMagnesium | +364.7% |
| Contains more CalciumCalcium | +191.2% |
| Contains more PotassiumPotassium | +78.8% |
| Contains more IronIron | +774.2% |
| Contains more ZincZinc | +278.6% |
| Contains more PhosphorusPhosphorus | +44.1% |
| Contains more ManganeseManganese | +815.3% |
| Contains more SeleniumSelenium | +400% |
| Contains less SodiumSodium | -96.2% |
Vitamin Comparison
Vitamin comparison score is based on the number of vitamins by which one or the other food is richer. The "coverage" charts below show how much of the daily needs can be covered by 300 grams of the food.
| Contains more Vitamin AVitamin A | +11625% |
| Contains more Vitamin EVitamin E | +39% |
| Contains more Vitamin B1Vitamin B1 | +188.9% |
| Contains more Vitamin B2Vitamin B2 | +656% |
| Contains more Vitamin B3Vitamin B3 | +112.3% |
| Contains more Vitamin B6Vitamin B6 | +209.5% |
| Contains more Vitamin KVitamin K | +1098.3% |
| Contains more FolateFolate | +676% |
| Contains more Vitamin CVitamin C | +229.9% |
| Contains more Vitamin B5Vitamin B5 | +181.5% |
All nutrients comparison - raw data values
| Nutrient |  |
 |
DV% diff. |
| Vitamin K | 482.9µg | 40.3µg | 369% |
| Vitamin C | 28.1mg | 92.7mg | 72% |
| Vitamin A | 469µg | 4µg | 52% |
| Folate | 194µg | 25µg | 42% |
| Manganese | 0.897mg | 0.098mg | 35% |
| Iron | 2.71mg | 0.31mg | 30% |
| Magnesium | 79mg | 17mg | 15% |
| Vitamin B2 | 0.189mg | 0.025mg | 13% |
| Vitamin B6 | 0.195mg | 0.063mg | 10% |
| Calcium | 99mg | 34mg | 7% |
| Potassium | 558mg | 312mg | 7% |
| Fructose | 0.15g | 4.35g | 5% |
| Carbs | 3.63g | 14.66g | 4% |
| Zinc | 0.53mg | 0.14mg | 4% |
| Vitamin E | 2.03mg | 1.46mg | 4% |
| Vitamin B1 | 0.078mg | 0.027mg | 4% |
| Protein | 2.86g | 1.14g | 3% |
| Fiber | 2.2g | 3g | 3% |
| Sodium | 79mg | 3mg | 3% |
| Calories | 23kcal | 61kcal | 2% |
| Phosphorus | 49mg | 34mg | 2% |
| Vitamin B3 | 0.724mg | 0.341mg | 2% |
| Vitamin B5 | 0.065mg | 0.183mg | 2% |
| Choline | 19.3mg | 7.8mg | 2% |
| Selenium | 1µg | 0.2µg | 1% |
| Polyunsaturated fat | 0.165g | 0.287g | 1% |
| Protein per 100 calories | 12g | 1.9g | N/A |
| Calories per 10 g protein | 80kcal | 535kcal | N/A |
| Weight per 100 calories | 435g | 164g | N/A |
| Fats | 0.39g | 0.52g | 0% |
| Net carbs | 1.43g | 11.66g | N/A |
| Sugar | 0.42g | 8.99g | N/A |
| Copper | 0.13mg | 0.13mg | 0% |
| Saturated fat | 0.063g | 0.029g | 0% |
| Monounsaturated fat | 0.01g | 0.047g | 0% |
| Tryptophan | 0.039mg | 0.015mg | 0% |
| Threonine | 0.122mg | 0.047mg | 0% |
| Isoleucine | 0.147mg | 0.051mg | 0% |
| Leucine | 0.223mg | 0.066mg | 0% |
| Lysine | 0.174mg | 0.061mg | 0% |
| Methionine | 0.053mg | 0.024mg | 0% |
| Phenylalanine | 0.129mg | 0.044mg | 0% |
| Valine | 0.161mg | 0.057mg | 0% |
| Histidine | 0.064mg | 0.027mg | 0% |
Macronutrient Comparison
Macronutrient breakdown side-by-side comparison
Protein:
2.86 g
Fats:
0.39 g
Carbs:
3.63 g
Water:
91.4 g
Other:
1.72 g
Protein:
1.14 g
Fats:
0.52 g
Carbs:
14.66 g
Water:
83.07 g
Other:
0.61 g
| Contains more ProteinProtein | +150.9% |
| Contains more OtherOther | +182% |
| Contains more FatsFats | +33.3% |
| Contains more CarbsCarbs | +303.9% |
~equal in
Water
~83.07g
Fat Type Comparison
Fat type breakdown side-by-side comparison
Saturated fat:
Sat. Fat
0.063 g
Monounsaturated fat:
Mono. Fat
0.01 g
Polyunsaturated fat:
Poly. Fat
0.165 g
Saturated fat:
Sat. Fat
0.029 g
Monounsaturated fat:
Mono. Fat
0.047 g
Polyunsaturated fat:
Poly. Fat
0.287 g
| Contains less Sat. FatSaturated fat | -54% |
| Contains more Mono. FatMonounsaturated fat | +370% |
| Contains more Poly. FatPolyunsaturated fat | +73.9% |
Carbohydrate type comparison
Carbohydrate type breakdown side-by-side comparison
Starch:
0 g
Sucrose:
0.07 g
Glucose:
0.11 g
Fructose:
0.15 g
Lactose:
0 g
Maltose:
0 g
Galactose:
0.1 g
Starch:
0 g
Sucrose:
0.15 g
Glucose:
4.11 g
Fructose:
4.35 g
Lactose:
0 g
Maltose:
0.19 g
Galactose:
0.17 g
| Contains more SucroseSucrose | +114.3% |
| Contains more GlucoseGlucose | +3636.4% |
| Contains more FructoseFructose | +2800% |
| Contains more MaltoseMaltose | +∞% |
| Contains more GalactoseGalactose | +70% |
~equal in
Starch
~0g
~equal in
Lactose
~0g