Water, with corn syrup and/or sugar and low calorie sweetener, fruit flavored vs. Drinking water — In-Depth Nutrition Comparison
Compare
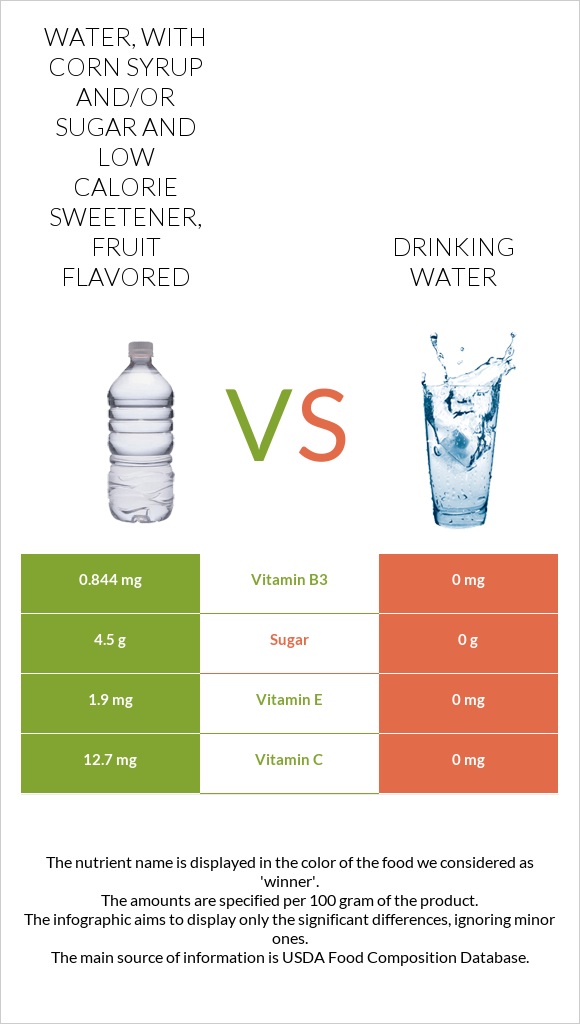
How are water, with corn syrup and/or sugar and low calorie sweetener, fruit flavored and drinking water different?
- Water, with corn syrup and/or sugar and low calorie sweetener, fruit flavored is higher than drinking water in vitamin C, vitamin E, vitamin B12, vitamin B6, and vitamin B3.
- Water, with corn syrup and/or sugar and low calorie sweetener, fruit flavored covers your daily need for vitamin C, 14% more than drinking water.
- Drinking water is lower in sugar.
Water, with corn syrup and/or sugar and low calorie sweetener, fruit flavored and Beverages, water, tap, drinking types were used in this article.
Infographic
Infographic link
Mineral Comparison
Mineral comparison score is based on the number of minerals by which one or the other food is richer. The "coverage" charts below show how much of the daily needs can be covered by 300 grams of the food.
| Contains more MagnesiumMagnesium | +200% |
| Contains more CalciumCalcium | +466.7% |
| Contains more ZincZinc | +3100% |
| Contains more CopperCopper | +42.9% |
| Contains less SodiumSodium | -50% |
Vitamin Comparison
Vitamin comparison score is based on the number of vitamins by which one or the other food is richer. The "coverage" charts below show how much of the daily needs can be covered by 300 grams of the food.
| Contains more Vitamin CVitamin C | +∞% |
| Contains more Vitamin AVitamin A | +∞% |
| Contains more Vitamin EVitamin E | +∞% |
| Contains more Vitamin B3Vitamin B3 | +∞% |
| Contains more Vitamin B6Vitamin B6 | +∞% |
| Contains more Vitamin B12Vitamin B12 | +∞% |
| Contains more FolateFolate | +∞% |
All nutrients comparison - raw data values
| Nutrient |  |
 |
DV% diff. |
| Vitamin C | 12.7mg | 0mg | 14% |
| Vitamin E | 1.9mg | 0mg | 13% |
| Vitamin B12 | 0.25µg | 0µg | 10% |
| Vitamin B6 | 0.084mg | 0mg | 6% |
| Vitamin B3 | 0.844mg | 0mg | 5% |
| Vitamin A | 32µg | 0µg | 4% |
| Zinc | 0.32mg | 0.01mg | 3% |
| Carbs | 4.5g | 0g | 2% |
| Folate | 8µg | 0µg | 2% |
| Calories | 18kcal | 0kcal | 1% |
| Calcium | 17mg | 3mg | 1% |
| Weight per 100 calories | 556g | N/A | |
| Net carbs | 4.5g | 0g | N/A |
| Magnesium | 3mg | 1mg | 0% |
| Sugar | 4.5g | 0g | N/A |
| Copper | 0.007mg | 0.01mg | 0% |
| Sodium | 8mg | 4mg | 0% |
Macronutrient Comparison
Macronutrient breakdown side-by-side comparison
Protein:
0 g
Fats:
0 g
Carbs:
4.5 g
Water:
94.44 g
Other:
1.06 g
Protein:
0 g
Fats:
0 g
Carbs:
0 g
Water:
99.9 g
Other:
0.1 g
| Contains more CarbsCarbs | +∞% |
| Contains more OtherOther | +960% |
~equal in
Protein
~0g
~equal in
Fats
~0g
~equal in
Water
~99.9g