Alcoholic beverage, beer, light vs. Malt beer — In-Depth Nutrition Comparison
Compare
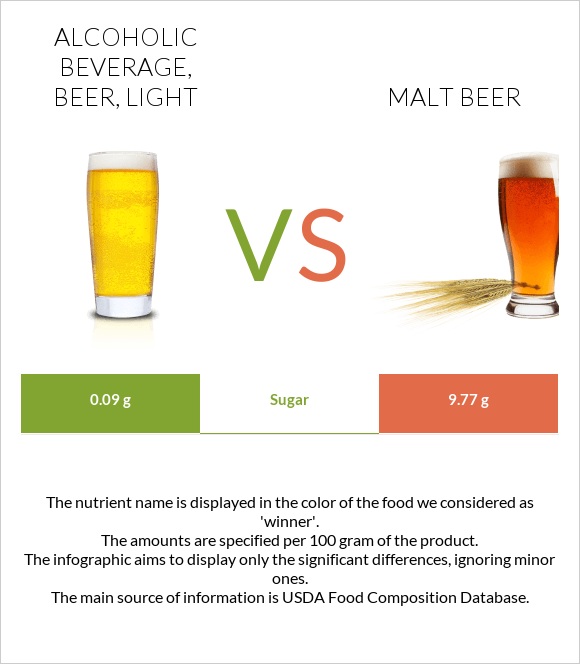
A recap on the differences between alcoholic beverage, beer, light and malt beer
Food varieties used in this article are Alcoholic beverage, beer, light and Alcoholic beverage, malt beer, hard lemonade.
Infographic
Infographic link
Mineral Comparison
Mineral comparison score is based on the number of minerals by which one or the other food is richer. The "coverage" charts below show how much of the daily needs can be covered by 300 grams of the food.
| Contains more MagnesiumMagnesium | +25% |
| Contains more PhosphorusPhosphorus | +71.4% |
| Contains less SodiumSodium | -20% |
| Contains more SeleniumSelenium | +33.3% |
| Contains more PotassiumPotassium | +28.6% |
| Contains more CopperCopper | +33.3% |
Vitamin Comparison
Vitamin comparison score is based on the number of vitamins by which one or the other food is richer. The "coverage" charts below show how much of the daily needs can be covered by 300 grams of the food.
| Contains more Vitamin B2Vitamin B2 | +50% |
| Contains more Vitamin B3Vitamin B3 | +73.8% |
| Contains more Vitamin B6Vitamin B6 | +54.5% |
| Contains more Vitamin B12Vitamin B12 | +100% |
| Contains more FolateFolate | +50% |
| Contains more Vitamin CVitamin C | +∞% |
| Contains more Vitamin EVitamin E | +∞% |
| Contains more Vitamin B1Vitamin B1 | +20% |
| Contains more Vitamin B5Vitamin B5 | +36.7% |
All nutrients comparison - raw data values
| Nutrient |  |
 |
DV% diff. |
| Fructose | 0g | 3.91g | 5% |
| Vitamin C | 0mg | 2.8mg | 3% |
| Carbs | 1.64g | 10.07g | 3% |
| Calories | 29kcal | 68kcal | 2% |
| Phosphorus | 12mg | 7mg | 1% |
| Vitamin B3 | 0.391mg | 0.225mg | 1% |
| Vitamin B6 | 0.034mg | 0.022mg | 1% |
| Folate | 6µg | 4µg | 1% |
| Choline | 8.8mg | 4.4mg | 1% |
| Protein | 0.24g | 0g | 0% |
| Weight per 100 calories | 345g | 147g | N/A |
| Net carbs | 1.64g | 10.07g | N/A |
| Magnesium | 5mg | 4mg | 0% |
| Calcium | 4mg | 4mg | 0% |
| Potassium | 21mg | 27mg | 0% |
| Iron | 0.03mg | 0.03mg | 0% |
| Sugar | 0.09g | 9.77g | N/A |
| Copper | 0.006mg | 0.008mg | 0% |
| Zinc | 0.01mg | 0.01mg | 0% |
| Sodium | 4mg | 5mg | 0% |
| Vitamin E | 0mg | 0.02mg | 0% |
| Manganese | 0.006mg | 0.006mg | 0% |
| Selenium | 0.4µg | 0.3µg | 0% |
| Vitamin B1 | 0.005mg | 0.006mg | 0% |
| Vitamin B2 | 0.015mg | 0.01mg | 0% |
| Vitamin B5 | 0.03mg | 0.041mg | 0% |
| Vitamin B12 | 0.02µg | 0.01µg | 0% |
Macronutrient Comparison
Macronutrient breakdown side-by-side comparison
Protein:
0.24 g
Fats:
0 g
Carbs:
1.64 g
Water:
94.88 g
Other:
3.24 g
Protein:
0 g
Fats:
0 g
Carbs:
10.07 g
Water:
85.74 g
Other:
4.19 g
| Contains more ProteinProtein | +∞% |
| Contains more CarbsCarbs | +514% |
| Contains more OtherOther | +29.3% |
~equal in
Fats
~0g
~equal in
Water
~85.74g
Carbohydrate type comparison
Carbohydrate type breakdown side-by-side comparison
Starch:
0 g
Sucrose:
0 g
Glucose:
0.09 g
Fructose:
0 g
Lactose:
0 g
Maltose:
0 g
Galactose:
0 g
Starch:
0 g
Sucrose:
2.11 g
Glucose:
3.55 g
Fructose:
3.91 g
Lactose:
0 g
Maltose:
0.1 g
Galactose:
0 g
| Contains more SucroseSucrose | +∞% |
| Contains more GlucoseGlucose | +3844.4% |
| Contains more FructoseFructose | +∞% |
| Contains more MaltoseMaltose | +∞% |
~equal in
Starch
~0g
~equal in
Lactose
~0g
~equal in
Galactose
~0g