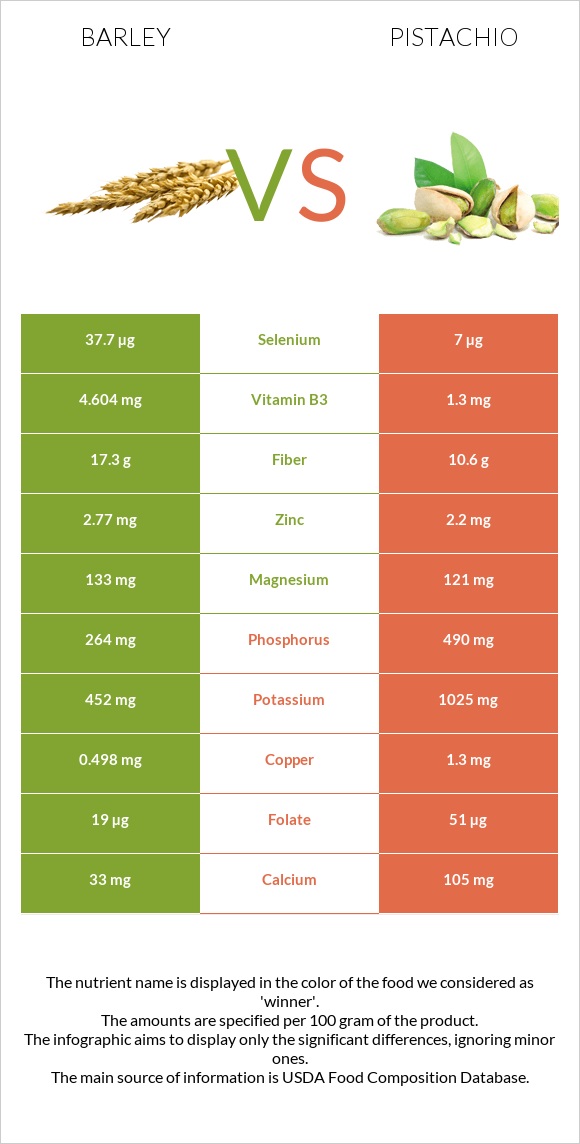
A recap on the differences between barley and pistachios Barley has more selenium, manganese, fiber, and vitamin B3; however, pistachios are higher in vitamin B6, copper, phosphorus, vitamin B1, and potassium. Pistachios cover your daily vitamin B6 needs 106% more than barley. Pistachios contain 5 times less selenium than barley. Barley contains 37.7µg of selenium, while pistachios contain 7µg. Barley has less saturated fat. Food varieties used in this article are Barley, hulled and Nuts, pistachio nuts, raw .
Infographic
Mineral Comparison
Mineral comparison score is based on the number of minerals by which one or the other food is richer. The "coverage" charts below show how much of the daily needs can be covered by 300 grams of the food.
3
100 g
300 g
1 cup - 184g
Magnesium
Magnesium
Calcium
Calcium
Potassium
Potassium
Iron
Iron
Copper
Copper
Zinc
Zinc
Phosphorus
Phosphorus
Sodium
Sodium
Manganese
Manganese
Selenium
Selenium
95%
9.9%
40%
135%
166%
76%
113%
1.6%
253%
206%
5
100 g
300 g
1 kernel - 0.7g 1 oz (49 kernels) - 28.35g 1 cup - 123g
Magnesium
Magnesium
Calcium
Calcium
Potassium
Potassium
Iron
Iron
Copper
Copper
Zinc
Zinc
Phosphorus
Phosphorus
Sodium
Sodium
Manganese
Manganese
Selenium
Selenium
86%
32%
90%
147%
433%
60%
210%
0.13%
157%
38%
Vitamin Comparison
Vitamin comparison score is based on the number of vitamins by which one or the other food is richer. The "coverage" charts below show how much of the daily needs can be covered by 300 grams of the food.
3
100 g
300 g
1 cup - 184g
Vitamin C
Vit. C
Vitamin D
Vit. D
Vitamin A
Vit. A
Vitamin E
Vit. E
Vitamin B1
Vit. B1
Vitamin B2
Vit. B2
Vitamin B3
Vit. B3
Vitamin B5
Vit. B5
Vitamin B6
Vit. B6
Vitamin B12
Vit. B12
Vitamin K
Vit. K
Folate
Folate
0%
0%
0.33%
11%
162%
66%
86%
17%
73%
0%
5.5%
14%
7
100 g
300 g
1 kernel - 0.7g 1 oz (49 kernels) - 28.35g 1 cup - 123g
Vitamin C
Vit. C
Vitamin D
Vit. D
Vitamin A
Vit. A
Vitamin E
Vit. E
Vitamin B1
Vit. B1
Vitamin B2
Vit. B2
Vitamin B3
Vit. B3
Vitamin B5
Vit. B5
Vitamin B6
Vit. B6
Vitamin B12
Vit. B12
Vitamin K
Vit. K
Folate
Folate
19%
0%
8.7%
57%
218%
37%
24%
31%
392%
0%
0%
38%
All nutrients comparison - raw data values
Nutrient
DV% diff.
Vitamin B6
0.318mg
1.7mg
106%
Copper
0.498mg
1.3mg
89%
Polyunsaturated fat
1.108g
14.38g
88%
Fats
2.3g
45.32g
66%
Monounsaturated fat
0.295g
23.257g
57%
Selenium
37.7µg
7µg
56%
Phosphorus
264mg
490mg
32%
Manganese
1.943mg
1.2mg
32%
Fiber
17.3g
10.6g
27%
Saturated fat
0.482g
5.907g
25%
Vitamin B3
4.604mg
1.3mg
21%
Vitamin B1
0.646mg
0.87mg
19%
Potassium
452mg
1025mg
17%
Protein
12.48g
20.16g
15%
Carbs
73.48g
27.17g
15%
Vitamin E
0.57mg
2.86mg
15%
Calories
354kcal
560kcal
10%
Vitamin B2
0.285mg
0.16mg
10%
Folate
19µg
51µg
8%
Calcium
33mg
105mg
7%
Vitamin C
0mg
5.6mg
6%
Zinc
2.77mg
2.2mg
5%
Vitamin B5
0.282mg
0.52mg
5%
Iron
3.6mg
3.92mg
4%
Magnesium
133mg
121mg
3%
Vitamin A
1µg
26µg
3%
Vitamin K
2.2µg
2%
Starch
1.67g
1%
Protein per 100 calories
3.5g
3.6g
N/A
Calories per 10 g protein
284kcal
278kcal
N/A
Weight per 100 calories
28g
18g
N/A
Unsaturated / Saturated Fat ratio
2.9
6.4
N/A
Net carbs
56.18g
16.57g
N/A
Sugar
0.8g
7.66g
N/A
Sodium
12mg
1mg
0%
Tryptophan
0.208mg
0.251mg
0%
Threonine
0.424mg
0.684mg
0%
Isoleucine
0.456mg
0.917mg
0%
Leucine
0.848mg
1.604mg
0%
Lysine
0.465mg
1.138mg
0%
Methionine
0.24mg
0.36mg
0%
Phenylalanine
0.7mg
1.092mg
0%
Valine
0.612mg
1.249mg
0%
Histidine
0.281mg
0.512mg
0%
Fructose
0.24g
0%
Omega-6 - Linoleic acid
14.091g
N/A
Macronutrient Comparison
Macronutrient breakdown side-by-side comparison
2
12%
2%
73%
9%
2%
Protein:
12.48 g
Fats:
2.3 g
Carbs:
73.48 g
Water:
9.44 g
Other:
2.3 g
3
20%
45%
27%
4%
3%
Protein:
20.16 g
Fats:
45.32 g
Carbs:
27.17 g
Water:
4.37 g
Other:
2.98 g
Contains
more
Carbs Carbs
+170.4%
Contains
more
Water Water
+116%
Contains
more
Protein Protein
+61.5%
Contains
more
Fats Fats
+1870.4%
Contains
more
Other Other
+29.6%
Fat Type Comparison
Fat type breakdown side-by-side comparison
1
26%
16%
59%
Saturated fat:
Sat. Fat
0.482 g
Monounsaturated fat:
Mono. Fat
0.295 g
Polyunsaturated fat:
Poly. Fat
1.108 g
2
14%
53%
33%
Saturated fat:
Sat. Fat
5.907 g
Monounsaturated fat:
Mono. Fat
23.257 g
Polyunsaturated fat:
Poly. Fat
14.38 g
Contains
less
Sat. Fat Saturated fat
-91.8%
Contains
more
Mono. Fat Monounsaturated fat
+7783.7%
Contains
more
Poly. Fat Polyunsaturated fat
+1197.8%