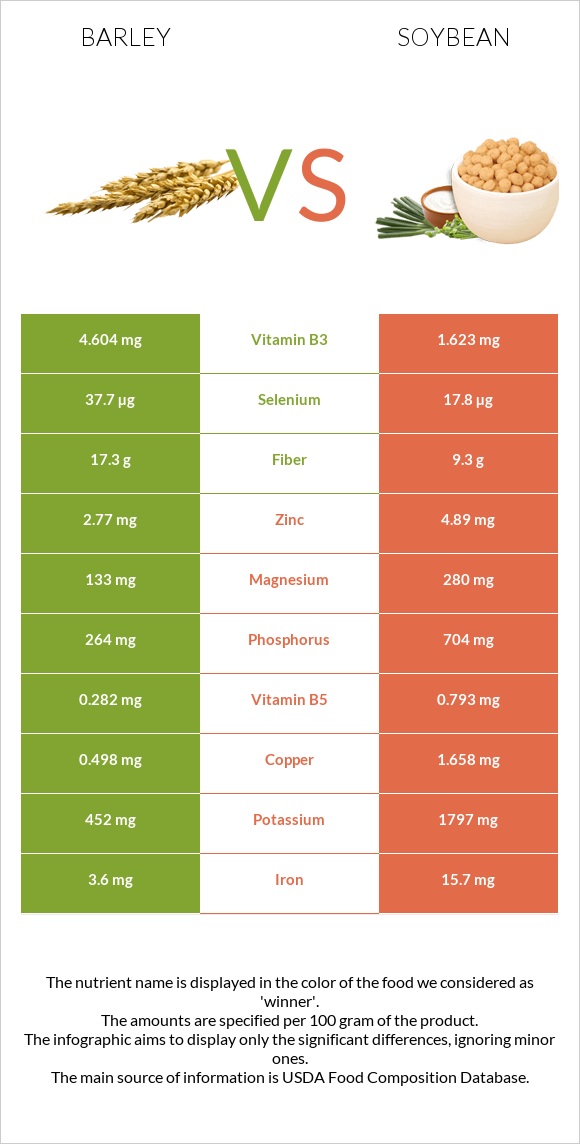
A recap on the differences between barley and soybeans Barley is higher in vitamin B3, yet soybeans are higher in iron, copper, phosphorus, manganese, vitamin B2, vitamin K, magnesium, potassium, and folate. Soybeans cover your daily iron needs 48% more than barley. Barley contains 5 times more vitamin B3 than soybeans. While barley contains 2.063mg of vitamin B3, soybeans contain only 0.399mg. The glycemic index of soybeans is lower. Food varieties used in this article are Barley, pearled, cooked and Soybeans, mature cooked, boiled, without salt .
Infographic
Mineral Comparison
Mineral comparison score is based on the number of minerals by which one or the other food is richer. The "coverage" charts below show how much of the daily needs can be covered by 300 grams of the food.
1
100 g
300 g
1 cup - 157g
Magnesium
Magnesium
Calcium
Calcium
Potassium
Potassium
Iron
Iron
Copper
Copper
Zinc
Zinc
Phosphorus
Phosphorus
Sodium
Sodium
Manganese
Manganese
Selenium
Selenium
16%
3.3%
8.2%
50%
35%
22%
23%
0.39%
34%
47%
9
100 g
300 g
1 tbsp - 10.7g 1 cup - 172g
Magnesium
Magnesium
Calcium
Calcium
Potassium
Potassium
Iron
Iron
Copper
Copper
Zinc
Zinc
Phosphorus
Phosphorus
Sodium
Sodium
Manganese
Manganese
Selenium
Selenium
61%
31%
45%
193%
136%
31%
105%
0.13%
107%
40%
Vitamin Comparison
Vitamin comparison score is based on the number of vitamins by which one or the other food is richer. The "coverage" charts below show how much of the daily needs can be covered by 300 grams of the food.
1
100 g
300 g
1 cup - 157g
Vitamin C
Vit. C
Vitamin D
Vit. D
Vitamin A
Vit. A
Vitamin E
Vit. E
Vitamin B1
Vit. B1
Vitamin B2
Vit. B2
Vitamin B3
Vit. B3
Vitamin B5
Vit. B5
Vitamin B6
Vit. B6
Vitamin B12
Vit. B12
Vitamin K
Vit. K
Folate
Folate
0%
0%
0%
0.2%
21%
14%
39%
8.1%
27%
0%
2%
12%
8
100 g
300 g
1 tbsp - 10.7g 1 cup - 172g
Vitamin C
Vit. C
Vitamin D
Vit. D
Vitamin A
Vit. A
Vitamin E
Vit. E
Vitamin B1
Vit. B1
Vitamin B2
Vit. B2
Vitamin B3
Vit. B3
Vitamin B5
Vit. B5
Vitamin B6
Vit. B6
Vitamin B12
Vit. B12
Vitamin K
Vit. K
Folate
Folate
5.7%
0%
0%
7%
39%
66%
7.5%
11%
54%
0%
48%
41%
All nutrients comparison - raw data values
Nutrient
DV% diff.
Iron
1.33mg
5.14mg
48%
Copper
0.105mg
0.407mg
34%
Protein
2.26g
18.21g
32%
Polyunsaturated fat
0.214g
5.064g
32%
Phosphorus
54mg
245mg
27%
Manganese
0.259mg
0.824mg
25%
Vitamin B2
0.062mg
0.285mg
17%
Magnesium
22mg
86mg
15%
Vitamin K
0.8µg
19.2µg
15%
Fats
0.44g
8.97g
13%
Potassium
93mg
515mg
12%
Vitamin B3
2.063mg
0.399mg
10%
Folate
16µg
54µg
10%
Calcium
11mg
102mg
9%
Fiber
3.8g
6g
9%
Vitamin B6
0.115mg
0.234mg
9%
Carbs
28.22g
8.36g
7%
Vitamin B1
0.083mg
0.155mg
6%
Choline
13.4mg
47.5mg
6%
Saturated fat
0.093g
1.297g
5%
Monounsaturated fat
0.057g
1.981g
5%
Zinc
0.82mg
1.15mg
3%
Calories
123kcal
172kcal
2%
Vitamin C
0mg
1.7mg
2%
Vitamin E
0.01mg
0.35mg
2%
Selenium
8.6µg
7.3µg
2%
Vitamin B5
0.135mg
0.179mg
1%
Protein per 100 calories
1.8g
11g
N/A
Calories per 10 g protein
544kcal
94kcal
N/A
Weight per 100 calories
81g
58g
N/A
Unsaturated / Saturated Fat ratio
2.9
5.4
N/A
Net carbs
24.42g
2.36g
N/A
Sugar
0.28g
3g
N/A
Sodium
3mg
1mg
0%
Tryptophan
0.038mg
0.242mg
0%
Threonine
0.077mg
0.723mg
0%
Isoleucine
0.083mg
0.807mg
0%
Leucine
0.154mg
1.355mg
0%
Lysine
0.084mg
1.108mg
0%
Methionine
0.043mg
0.224mg
0%
Phenylalanine
0.127mg
0.869mg
0%
Valine
0.111mg
0.831mg
0%
Histidine
0.051mg
0.449mg
0%
Macronutrient Comparison
Macronutrient breakdown side-by-side comparison
2
2%
28%
69%
Protein:
2.26 g
Fats:
0.44 g
Carbs:
28.22 g
Water:
68.8 g
Other:
0.28 g
3
18%
9%
8%
63%
2%
Protein:
18.21 g
Fats:
8.97 g
Carbs:
8.36 g
Water:
62.55 g
Other:
1.91 g
Contains
more
Carbs Carbs
+237.6%
Contains
more
Protein Protein
+705.8%
Contains
more
Fats Fats
+1938.6%
Contains
more
Other Other
+582.1%
Fat Type Comparison
Fat type breakdown side-by-side comparison
1
26%
16%
59%
Saturated fat:
Sat. Fat
0.093 g
Monounsaturated fat:
Mono. Fat
0.057 g
Polyunsaturated fat:
Poly. Fat
0.214 g
2
16%
24%
61%
Saturated fat:
Sat. Fat
1.297 g
Monounsaturated fat:
Mono. Fat
1.981 g
Polyunsaturated fat:
Poly. Fat
5.064 g
Contains
less
Sat. Fat Saturated fat
-92.8%
Contains
more
Mono. Fat Monounsaturated fat
+3375.4%
Contains
more
Poly. Fat Polyunsaturated fat
+2266.4%