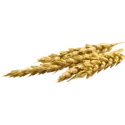
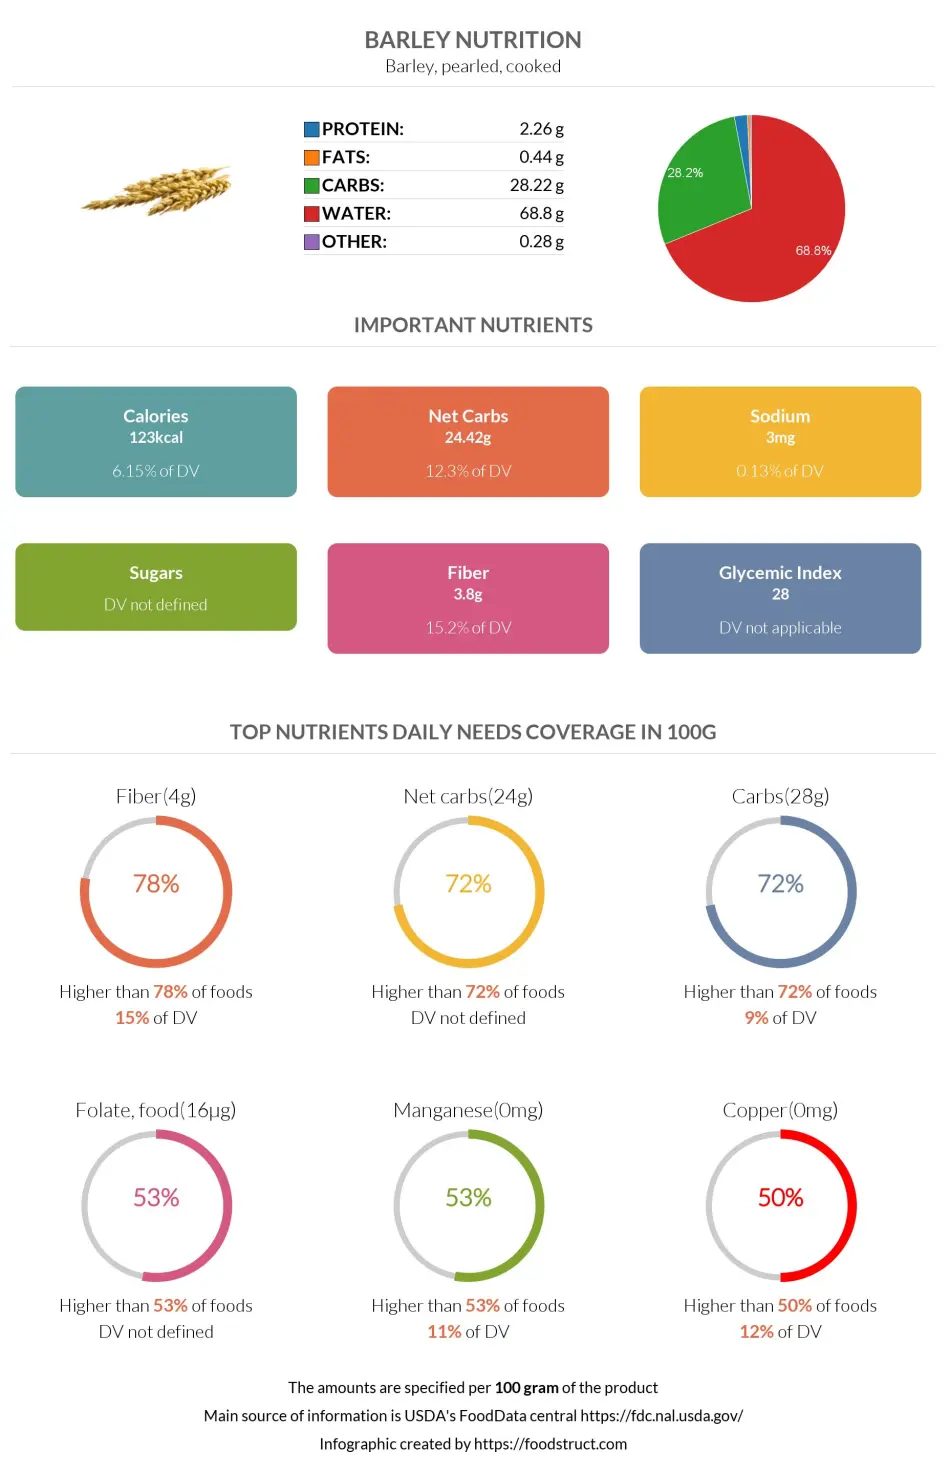
Barley nutrition: calories, carbs, GI, protein, fiber, fats
Carbs in Barley
Cooked barley primarily consists of water. 100g of cooked barley provides 28.3 grams of carbs, equalling 9% of the daily carbohydrate requirements.
Macronutrients chart
Carbs per serving size
Barley is usually served in one cup, equal to 157 grams.
One serving of Barley contains 44 grams of carbohydrates.
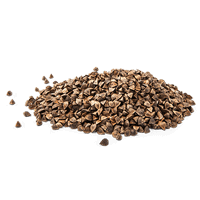
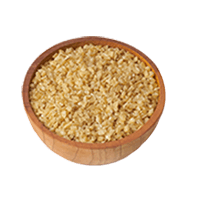
Different types
You can usually find Barley in two forms: pearled and hulled. In this article, we discuss the carb content of pearled cooked barley.
Hulled barley has more carbs than pearled, cooked barley, about 74 grams per 100g.
When we cook pearled barley, things are getting better for people looking for a low-carb diet: cooked barley contains 28.3g of carbs per 100g.
Barley net carbs
From 28.3 grams of carbohydrates in Barley, 3.8 grams are fiber, which results in 24.5 grams of net carbs per 100g.
Soluble or insoluble fiber
Most of the fiber contained in Barley is soluble. This food is rich in beta-glucan, a type of soluble fiber with cholesterol-lowering properties.
Fiber content ratio for Barley

Top nutrition facts for Barley
| Calories ⓘ Calories for selected serving | 123 kcal |
|
Glycemic index ⓘ
Source:
Check out our Glycemic index chart page for the full list.
|
28 (low) |
| Glycemic load ⓘ Glycemic Load (GL) is a metric that measures both the quality (Glycemic Index) and quantity of carbohydrates in a specific serving of food to estimate its impact on blood sugar levels. It is calculated as: (GI × Carbs in grams) / 100. | 11 (medium) |
| Net carbs ⓘ Net Carbs = Total Carbohydrates – Fiber – Sugar Alcohols | 24 g |
| Default serving size ⓘ Serving sizes are mostly taken from FDA's Reference Amounts Customarily Consumed (RACCs) | 1 cup (157 g) |
| Acidity (Based on PRAL) ⓘ PRAL (Potential renal acid load) is calculated using a formula. On the PRAL scale the higher the positive value, the more is the acidifying effect on the body. The lower the negative value, the higher the alkalinity of the food. 0 is neutral. | 0.4 (acidic) |
| Oxalates | 27 mg ⓘ https://pubmed.ncbi.nlm.nih.gov/16608223/ |
Barley calories (kcal)
| Calories for different serving sizes of barley | Calories | Weight |
|---|---|---|
| Calories in 100 grams | 123 | |
| Calories in 1 cup | 193 | 157 g |
| Calories for different varieties of barley | Calories | Weight |
|---|---|---|
| Barley, pearled, cooked (this food) | 123 | 100 g |
| Barley, pearled, raw | 352 | 100 g |
Extra Nutrition facts for Barley
| Protein per 100 calories ⓘ Shows how many grams of protein you get from 100 calories of this food, calculated as (protein in g ÷ calories) × 100. | 1.8 g |
| Calories per 10 g protein ⓘ Shows how many calories you need to eat from this food to get 10 g of protein, calculated as (calories ÷ protein in g) × 10. | 544 kcal |
| Weight per 100 calories ⓘ Shows how many grams of this food equal 100 kcal—higher grams mean a larger portion for the same calories. | 81 g |
Barley Glycemic index (GI)
Barley Glycemic load (GL)
Mineral coverage chart
Mineral chart - relative view
Vitamin coverage chart
Vitamin chart - relative view
Protein quality breakdown
Fat type information
All nutrients for Barley per 100g
| Nutrient | Value | DV% | In TOP % of foods | Comparison |
| Vitamin A | 0µg | 0% | 100% | |
| Calories | 123kcal | 6% | 68% |
2.6 times more than Orange
|
| Protein per 100 calories | 1.8g | N/A | 74% | |
| Protein | 2.3g | 5% | 76% |
1.2 times less than Broccoli
|
| Calories per 10 g protein | 544kcal | N/A | 23% | |
| Weight per 100 calories | 81g | N/A | 33% | |
| Fats | 0.44g | 1% | 82% |
75.7 times less than Cheese
|
| Vitamin C | 0mg | 0% | 100% |
N/A
|
| Net carbs | 24g | N/A | 29% |
2.2 times less than Chocolate
|
| Carbs | 28g | 9% | 28% |
Equal to Rice
|
| Cholesterol | 0mg | 0% | 100% |
N/A
|
| Vitamin D* | 0 IU | 0% | 100% |
N/A
|
| Vitamin D | 0µg | 0% | 100% |
N/A
|
| Magnesium | 22mg | 5% | 46% |
6.4 times less than Almonds
|
| Calcium | 11mg | 1% | 71% |
11.4 times less than Milk
|
| Potassium | 93mg | 3% | 80% |
1.6 times less than Cucumber
|
| Iron | 1.3mg | 17% | 50% |
2 times less than Beef broiled
|
| Sugar | 0.28g | N/A | 53% |
32 times less than Coca-Cola
|
| Fiber | 3.8g | 15% | 16% |
1.6 times more than Orange
|
| Copper | 0.11mg | 12% | 36% |
1.4 times less than Shiitake
|
| Zinc | 0.82mg | 7% | 50% |
7.7 times less than Beef broiled
|
| Phosphorus | 54mg | 8% | 70% |
3.4 times less than Chicken meat
|
| Sodium | 3mg | 0% | 93% |
163.3 times less than White bread
|
| Vitamin E | 0.01mg | 0% | 62% |
146 times less than Kiwi
|
| Manganese | 0.26mg | 11% | 23% | |
| Selenium | 8.6µg | 16% | 43% | |
| Vitamin B1 | 0.08mg | 7% | 47% |
3.2 times less than Pea raw
|
| Vitamin B2 | 0.06mg | 5% | 71% |
2.1 times less than Avocado
|
| Vitamin B3 | 2.1mg | 13% | 51% |
4.6 times less than Turkey meat
|
| Vitamin B5 | 0.14mg | 3% | 61% |
8.4 times less than Sunflower seeds
|
| Vitamin B6 | 0.12mg | 9% | 51% |
Equal to Oats
|
| Vitamin B12 | 0µg | 0% | 100% |
N/A
|
| Vitamin K | 0.8µg | 1% | 39% |
127 times less than Broccoli
|
| Folate | 16µg | 4% | 38% |
3.8 times less than Brussels sprouts
|
| Saturated fat | 0.09g | 0% | 78% |
63.4 times less than Beef broiled
|
| Choline | 13mg | 2% | 37% | |
| Monounsaturated fat | 0.06g | N/A | 77% |
171.9 times less than Avocado
|
| Polyunsaturated fat | 0.21g | N/A | 70% |
220.4 times less than Walnut
|
| Tryptophan | 0.04mg | 0% | 47% |
8 times less than Chicken meat
|
| Threonine | 0.08mg | 0% | 51% |
9.4 times less than Beef broiled
|
| Isoleucine | 0.08mg | 0% | 51% |
11 times less than Salmon raw
|
| Leucine | 0.15mg | 0% | 50% |
15.8 times less than Tuna Bluefin
|
| Lysine | 0.08mg | 0% | 51% |
5.4 times less than Tofu
|
| Methionine | 0.04mg | 0% | 49% |
2.2 times less than Quinoa
|
| Phenylalanine | 0.13mg | 0% | 48% |
5.3 times less than Egg
|
| Valine | 0.11mg | 0% | 50% |
18.3 times less than Soybean raw
|
| Histidine | 0.05mg | 0% | 50% |
14.7 times less than Turkey meat
|
| Caffeine | 0mg | 0% | 100% | |
| Omega-3 - EPA | 0g | N/A | 100% |
N/A
|
| Omega-3 - DHA | 0g | N/A | 100% |
N/A
|
| Omega-3 - DPA | 0g | N/A | 100% |
N/A
|
Check out similar food or compare with current
NUTRITION FACTS LABEL
Serving Size ______________
Health checks
Barley nutrition infographic
References
All the values for which the sources are not specified explicitly are taken from FDA’s Food Central. The exact link to the food presented on this page can be found below.