Basil vs. Spinach — Health Impact and Nutrition Comparison


Summary
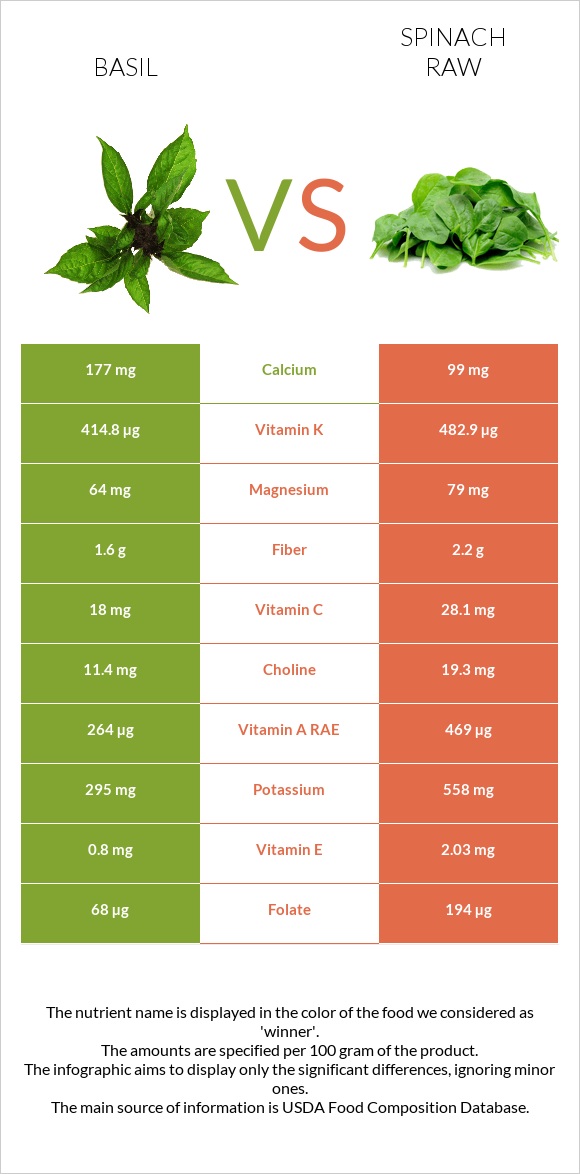
Spinach has 2 times more vitamin A, vitamin E, and potassium. It is also richer in fiber and protein.
On the other hand, basil has more calcium, iron, phosphorus, vitamin C, folate, and less sodium than spinach.
Introduction
With its round, pointed leaves, the basil plant frequently reminds us of peppermint. It is usually used as a seasoning herb for various dishes and is often considered “the king of herbs.” This green is the main ingredient in pesto. Its flavored mixture of pine nuts and parmesan is hard to forget.
The amazing versatility of spinach has been familiar to the culinary world for centuries. In contrast to basil, used as a seasoning, it is incorporated into our daily meals in many forms, be it raw, boiled, or cooked, and has numerous nutritional benefits.
Nutritional Content
Macronutrients
Spinach has a slightly higher number of carbs than basil, containing 3.63g of carbs per 100g, whereas basil has 2.65g of carbs.
However, spinach is also higher in fiber. Basil is richer in protein.
Macronutrient Comparison
Contains
more
FatsFats
+64.1%
Contains
more
CarbsCarbs
+37%
Contains
more
OtherOther
+14.7%
Vitamins
Spinach contains more vitamins than basil.
Spinach has 2 times more vitamin A and vitamin E than basil. It also is higher in vitamin C, folate, and vitamin K.
Both greens do not contain vitamin D and vitamin B12.
Vitamin Comparison
Contains
more
Vitamin B3Vitamin B3
+24.6%
Contains
more
Vitamin B5Vitamin B5
+221.5%
Contains
more
Vitamin CVitamin C
+56.1%
Contains
more
Vitamin AVitamin A
+77.7%
Contains
more
Vitamin EVitamin E
+153.8%
Contains
more
Vitamin B1Vitamin B1
+129.4%
Contains
more
Vitamin B2Vitamin B2
+148.7%
Contains
more
Vitamin B6Vitamin B6
+25.8%
Contains
more
Vitamin KVitamin K
+16.4%
Contains
more
FolateFolate
+185.3%
Minerals
In mineral content, basil is the winner, being richer in calcium, iron, phosphorus, and manganese. Basil is also lower in sodium.
100g of basil has 19 times less sodium than 100g of spinach.
Spinach, however, contains more potassium and magnesium.
Mineral Comparison
Contains
more
CalciumCalcium
+78.8%
Contains
more
IronIron
+17%
Contains
more
CopperCopper
+196.2%
Contains
more
ZincZinc
+52.8%
Contains
more
PhosphorusPhosphorus
+14.3%
Contains
less
SodiumSodium
-94.9%
Contains
more
ManganeseManganese
+28%
Contains
more
MagnesiumMagnesium
+23.4%
Contains
more
PotassiumPotassium
+89.2%
Contains
more
SeleniumSelenium
+233.3%
Glycemic Index
Even though both have low carb content, surprisingly, basil has a higher glycemic index than spinach.
The glycemic index of basil is equal to 70, while the gi of raw spinach is equal to 32.
Spinach is considered low glycemic index food.
Health Impact
As a concerned individual who cares for their health, you may ask, which is better?
Spinach appears to be part of more scientific studies. One study showed that it might reduce the risk of aggressive prostate cancer (1). The case is that increased consumption of leafy and carotenoid vegetables leads to decreased risk of prostate cancer.
Nonetheless, these two foods are high in many nutritional elements and are excellent for fighting against several health issues thanks to the following:
- Anti-bacterial properties (2, 3)
- Anti-inflammatory effects (4, 5)
- Anti-cancer properties (1, 6)
- Nutrients essential for cardiovascular health (due to magnesium and potassium contents)
Kidney Stones
Spinach contains oxalate, meaning that spinach may increase the chance of oxalate stone formation.
Increased oxalate consumption is associated with an increased risk of kidney stone development (7).
However, since oxalate is a water-soluble compound boiling and cooking vegetables more often reduces the oxalate content by more than 50%. (8)
References
- https://www.ncbi.nlm.nih.gov/pmc/articles/PMC3209415/
- https://pubmed.ncbi.nlm.nih.gov/12744643/
- https://www.researchgate.net/publication/336568422
- https://www.researchgate.net/publication/316307034
- https://www.ncbi.nlm.nih.gov/pmc/articles/PMC7399895/
- https://www.ncbi.nlm.nih.gov/pmc/articles/PMC3700662/
- https://pubmed.ncbi.nlm.nih.gov/30566003/
- https://pubmed.ncbi.nlm.nih.gov/15826055/

Infographic
All nutrients comparison - raw data values
| Nutrient | |
|
DV% diff. |
| Vitamin K | 414.8µg | 482.9µg | 57% |
| Folate | 68µg | 194µg | 32% |
| Copper | 0.385mg | 0.13mg | 28% |
| Vitamin A | 264µg | 469µg | 23% |
| Vitamin C | 18mg | 28.1mg | 11% |
| Manganese | 1.148mg | 0.897mg | 11% |
| Vitamin B2 | 0.076mg | 0.189mg | 9% |
| Calcium | 177mg | 99mg | 8% |
| Potassium | 295mg | 558mg | 8% |
| Vitamin E | 0.8mg | 2.03mg | 8% |
| Iron | 3.17mg | 2.71mg | 6% |
| Magnesium | 64mg | 79mg | 4% |
| Vitamin B1 | 0.034mg | 0.078mg | 4% |
| Zinc | 0.81mg | 0.53mg | 3% |
| Sodium | 4mg | 79mg | 3% |
| Vitamin B5 | 0.209mg | 0.065mg | 3% |
| Vitamin B6 | 0.155mg | 0.195mg | 3% |
| Fiber | 1.6g | 2.2g | 2% |
| Protein | 3.15g | 2.86g | 1% |
| Phosphorus | 56mg | 49mg | 1% |
| Selenium | 0.3µg | 1µg | 1% |
| Vitamin B3 | 0.902mg | 0.724mg | 1% |
| Choline | 11.4mg | 19.3mg | 1% |
| Polyunsaturated fat | 0.389g | 0.165g | 1% |
| Calories | 23kcal | 23kcal | 0% |
| Protein per 100 calories | 14g | 12g | N/A |
| Calories per 10 g protein | 73kcal | 80kcal | N/A |
| Weight per 100 calories | 435g | 435g | N/A |
| Fats | 0.64g | 0.39g | 0% |
| Net carbs | 1.05g | 1.43g | N/A |
| Carbs | 2.65g | 3.63g | 0% |
| Sugar | 0.3g | 0.42g | N/A |
| Saturated fat | 0.041g | 0.063g | 0% |
| Monounsaturated fat | 0.088g | 0.01g | 0% |
| Tryptophan | 0.039mg | 0.039mg | 0% |
| Threonine | 0.104mg | 0.122mg | 0% |
| Isoleucine | 0.104mg | 0.147mg | 0% |
| Leucine | 0.191mg | 0.223mg | 0% |
| Lysine | 0.11mg | 0.174mg | 0% |
| Methionine | 0.036mg | 0.053mg | 0% |
| Phenylalanine | 0.13mg | 0.129mg | 0% |
| Valine | 0.127mg | 0.161mg | 0% |
| Histidine | 0.051mg | 0.064mg | 0% |
| Fructose | 0.02g | 0.15g | 0% |
Fat Type Comparison
| Contains less Sat. FatSaturated fat | -34.9% |
| Contains more Mono. FatMonounsaturated fat | +780% |
| Contains more Poly. FatPolyunsaturated fat | +135.8% |
Carbohydrate type comparison
| Contains more GalactoseGalactose | +170% |
| Contains more SucroseSucrose | +∞% |
| Contains more GlucoseGlucose | +450% |
| Contains more FructoseFructose | +650% |
References
All the values for which the sources are not specified explicitly are taken from FDA’s Food Central. The exact link to the food presented on this page can be found below.
- Basil - https://fdc.nal.usda.gov/fdc-app.html#/food-details/172232/nutrients
- Spinach raw - https://fdc.nal.usda.gov/fdc-app.html#/food-details/168462/nutrients
All the Daily Values are presented for males aged 31-50, for 2000-calorie diets.