Beverages, Fruit flavored drink, less than 3% juice, not fortified with vitamin C vs. Red Bull — In-Depth Nutrition Comparison
Compare
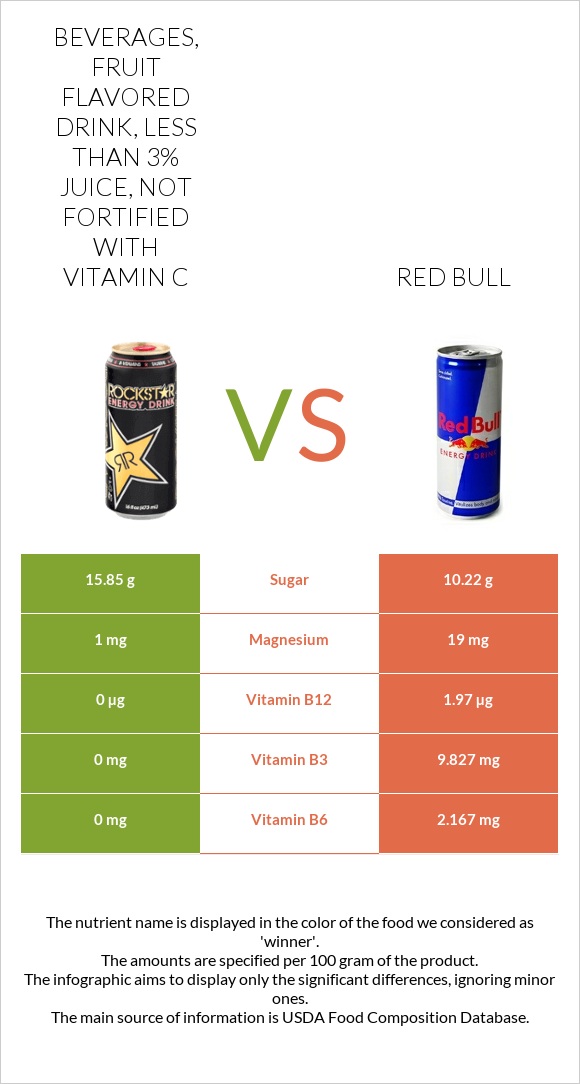
How are beverages, Fruit flavored drink, less than 3% juice, not fortified with vitamin C and Red Bull different?
- Red Bull has more vitamin B6, vitamin B12, vitamin B3, and vitamin B2 than beverages, Fruit flavored drink, less than 3% juice, not fortified with vitamin C.
- Daily need coverage for vitamin B6 for Red Bull is 167% higher.
- Beverages, Fruit flavored drink, less than 3% juice, not fortified with vitamin C contains 2 times more sugar than Red Bull. While beverages, Fruit flavored drink, less than 3% juice, not fortified with vitamin C contains 15.85g of sugar, Red Bull contains only 10.22g.
Beverages, Fruit flavored drink, less than 3% juice, not fortified with vitamin C and Beverages, Energy drink, RED BULL are the varieties used in this article.
Infographic
Infographic link
Mineral Comparison
Mineral comparison score is based on the number of minerals by which one or the other food is richer. The "coverage" charts below show how much of the daily needs can be covered by 300 grams of the food.
| Contains more PotassiumPotassium | +933.3% |
| Contains more CopperCopper | +350% |
| Contains more MagnesiumMagnesium | +1800% |
| Contains more CalciumCalcium | +100% |
| Contains more IronIron | +∞% |
| Contains more ZincZinc | +∞% |
| Contains more SeleniumSelenium | +∞% |
Vitamin Comparison
Vitamin comparison score is based on the number of vitamins by which one or the other food is richer. The "coverage" charts below show how much of the daily needs can be covered by 300 grams of the food.
| Contains more Vitamin B1Vitamin B1 | +∞% |
| Contains more Vitamin B2Vitamin B2 | +∞% |
| Contains more Vitamin B3Vitamin B3 | +∞% |
| Contains more Vitamin B6Vitamin B6 | +∞% |
| Contains more Vitamin B12Vitamin B12 | +∞% |
All nutrients comparison - raw data values
| Nutrient |  |
 |
DV% diff. |
| Vitamin B6 | 0mg | 2.167mg | 167% |
| Vitamin B12 | 0µg | 1.97µg | 82% |
| Vitamin B3 | 0mg | 9.827mg | 61% |
| Vitamin B5 | 1.54mg | 31% | |
| Vitamin B2 | 0mg | 0.103mg | 8% |
| Caffeine | 0mg | 29mg | 7% |
| Magnesium | 1mg | 19mg | 4% |
| Vitamin B1 | 0mg | 0.04mg | 3% |
| Carbs | 16.03g | 10.23g | 2% |
| Fructose | 1.63g | 2% | |
| Calories | 64kcal | 43kcal | 1% |
| Protein | 0g | 0.46g | 1% |
| Potassium | 31mg | 3mg | 1% |
| Iron | 0mg | 0.06mg | 1% |
| Copper | 0.009mg | 0.002mg | 1% |
| Protein per 100 calories | 0g | 1.1g | N/A |
| Calories per 10 g protein | 935kcal | N/A | |
| Weight per 100 calories | 156g | 233g | N/A |
| Net carbs | 16.03g | 10.23g | N/A |
| Calcium | 3mg | 6mg | 0% |
| Sugar | 15.85g | 10.22g | N/A |
| Zinc | 0mg | 0.01mg | 0% |
| Sodium | 36mg | 39mg | 0% |
| Manganese | 0.005mg | 0% | |
| Selenium | 0µg | 0.2µg | 0% |
| Choline | 0mg | 0.3mg | 0% |
Macronutrient Comparison
Macronutrient breakdown side-by-side comparison
Protein:
0 g
Fats:
0 g
Carbs:
16.03 g
Water:
83.87 g
Other:
0.1 g
Protein:
0.46 g
Fats:
0 g
Carbs:
10.23 g
Water:
89.22 g
Other:
0.09 g
| Contains more CarbsCarbs | +56.7% |
| Contains more ProteinProtein | +∞% |
~equal in
Fats
~0g
~equal in
Water
~89.22g
~equal in
Other
~0.09g