Candies, fruit snacks, with high vitamin C vs. Gumdrop — In-Depth Nutrition Comparison
Compare
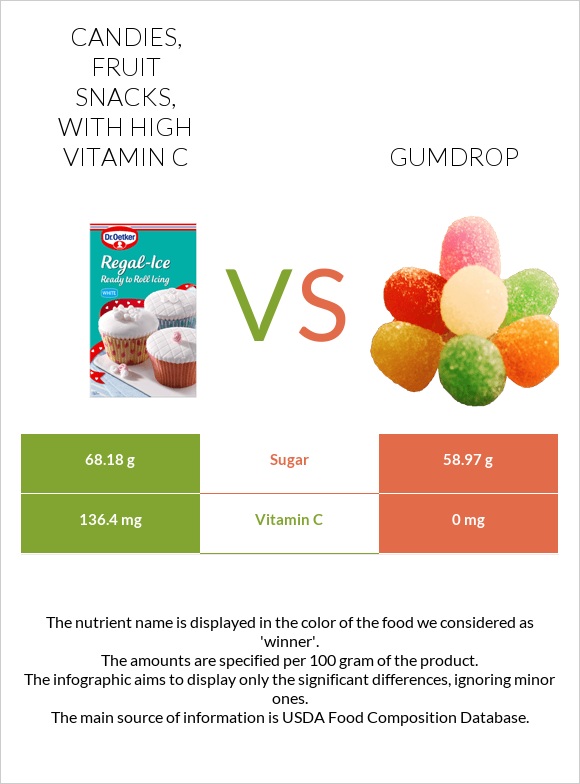
A recap on the differences between candies, fruit snacks, with high vitamin C and gumdrop
- Candies, fruit snacks, with high vitamin C is higher than gumdrop in vitamin C.
- Candies, fruit snacks, with high vitamin C covers your daily vitamin C needs 152% more than gumdrop.
Food varieties used in this article are Candies, fruit snacks, with high vitamin C and Candies, gumdrops, starch jelly pieces.
Infographic
Infographic link
Mineral Comparison
Mineral comparison score is based on the number of minerals by which one or the other food is richer. The "coverage" charts below show how much of the daily needs can be covered by 300 grams of the food.
| Contains more PotassiumPotassium | +60% |
| Contains more CopperCopper | +25% |
| Contains more ZincZinc | +∞% |
| Contains more PhosphorusPhosphorus | +200% |
| Contains less SodiumSodium | -47.7% |
| Contains more ManganeseManganese | +40% |
| Contains more SeleniumSelenium | +37.5% |
| Contains more CalciumCalcium | +∞% |
| Contains more IronIron | +∞% |
Vitamin Comparison
Vitamin comparison score is based on the number of vitamins by which one or the other food is richer. The "coverage" charts below show how much of the daily needs can be covered by 300 grams of the food.
| Contains more Vitamin CVitamin C | +∞% |
| Contains more Vitamin B1Vitamin B1 | +316.7% |
| Contains more FolateFolate | +∞% |
| Contains more Vitamin B2Vitamin B2 | +62.5% |
| Contains more Vitamin B3Vitamin B3 | +25% |
| Contains more Vitamin B5Vitamin B5 | +100% |
| Contains more Vitamin B6Vitamin B6 | +400% |
All nutrients comparison - raw data values
| Nutrient |  |
 |
DV% diff. |
| Vitamin C | 136.4mg | 0mg | 152% |
| Iron | 0mg | 0.4mg | 5% |
| Carbs | 87.97g | 98.9g | 4% |
| Calories | 352kcal | 396kcal | 2% |
| Zinc | 0.19mg | 0mg | 2% |
| Vitamin B1 | 0.025mg | 0.006mg | 2% |
| Sodium | 23mg | 44mg | 1% |
| Selenium | 1.1µg | 0.8µg | 1% |
| Protein | 0.08g | 0g | 0% |
| Weight per 100 calories | 28g | 25g | N/A |
| Net carbs | 87.97g | 98.8g | N/A |
| Magnesium | 1mg | 1mg | 0% |
| Calcium | 0mg | 3mg | 0% |
| Potassium | 8mg | 5mg | 0% |
| Sugar | 68.18g | 58.97g | N/A |
| Fiber | 0g | 0.1g | 0% |
| Copper | 0.015mg | 0.012mg | 0% |
| Phosphorus | 3mg | 1mg | 0% |
| Manganese | 0.014mg | 0.01mg | 0% |
| Vitamin B2 | 0.008mg | 0.013mg | 0% |
| Vitamin B3 | 0.008mg | 0.01mg | 0% |
| Vitamin B5 | 0.006mg | 0.012mg | 0% |
| Vitamin B6 | 0.001mg | 0.005mg | 0% |
| Folate | 1µg | 0µg | 0% |
| Choline | 0.3mg | 0mg | 0% |
Macronutrient Comparison
Macronutrient breakdown side-by-side comparison
Protein:
0.08 g
Fats:
0 g
Carbs:
87.97 g
Water:
11.84 g
Other:
0.11 g
Protein:
0 g
Fats:
0 g
Carbs:
98.9 g
Water:
1 g
Other:
0.1 g
| Contains more ProteinProtein | +∞% |
| Contains more WaterWater | +1084% |
| Contains more CarbsCarbs | +12.4% |
~equal in
Fats
~0g
~equal in
Other
~0.1g