Candies, MARS SNACKFOOD US, MILKY WAY Caramels. dark chocolate covered vs. Snickers — In-Depth Nutrition Comparison
Compare
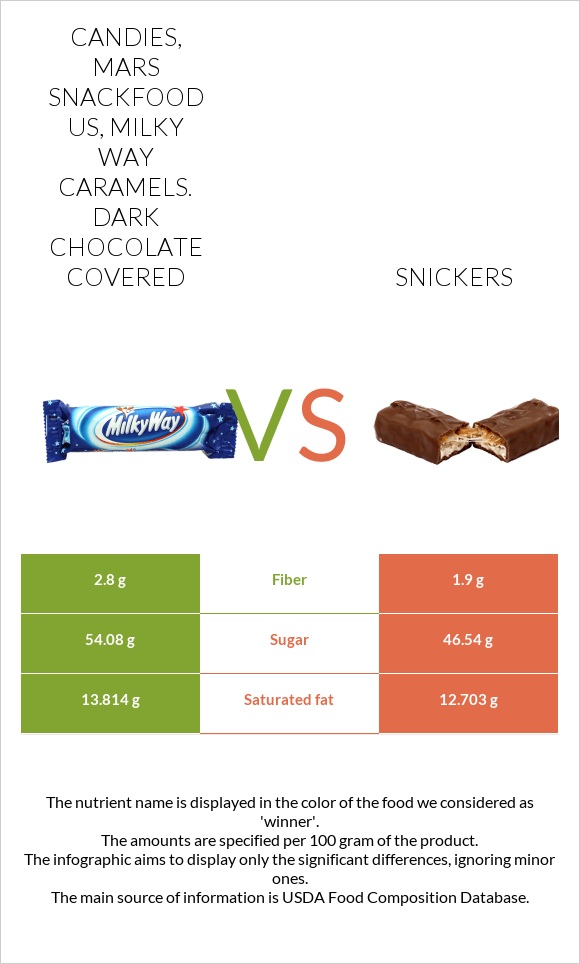
What are the differences between candies, MARS SNACKFOOD US, MILKY WAY Caramels. dark chocolate covered and snickers?
- The amount of iron in candies, MARS SNACKFOOD US, MILKY WAY Caramels. Dark chocolate covered is higher than in snickers.
- Snickers has less sugar.
We used Candies, MARS SNACKFOOD US, MILKY WAY Caramels. Dark chocolate covered and Candies, MARS SNACKFOOD US, SNICKERS CRUNCHER types in this article.
Infographic
Infographic link
Mineral Comparison
Mineral comparison score is based on the number of minerals by which one or the other food is richer. The "coverage" charts below show how much of the daily needs can be covered by 300 grams of the food.
| Contains more IronIron | +76.5% |
| Contains less SodiumSodium | -23.2% |
Vitamin Comparison
Vitamin comparison score is based on the number of vitamins by which one or the other food is richer. The "coverage" charts below show how much of the daily needs can be covered by 300 grams of the food.
| Contains more Vitamin CVitamin C | +25% |
All nutrients comparison - raw data values
| Nutrient |  |
 |
DV% diff. |
| Iron | 1.2mg | 0.68mg | 7% |
| Protein | 3.82g | 6.86g | 6% |
| Fats | 20.42g | 24.38g | 6% |
| Saturated fat | 13.814g | 12.703g | 5% |
| Fiber | 2.8g | 1.9g | 4% |
| Cholesterol | 17mg | 9mg | 3% |
| Calories | 458kcal | 488kcal | 2% |
| Carbs | 67.56g | 62.85g | 2% |
| Sodium | 246mg | 189mg | 2% |
| Calcium | 83mg | 90mg | 1% |
| Protein per 100 calories | 0.83g | 1.4g | N/A |
| Calories per 10 g protein | 1199kcal | 711kcal | N/A |
| Weight per 100 calories | 22g | 20g | N/A |
| Vitamin C | 0.4mg | 0.5mg | 0% |
| Net carbs | 64.76g | 60.95g | N/A |
| Sugar | 54.08g | 46.54g | N/A |
| Trans fat | 0.274g | 0.394g | N/A |
Macronutrient Comparison
Macronutrient breakdown side-by-side comparison
Protein:
3.82 g
Fats:
20.42 g
Carbs:
67.56 g
Water:
6.99 g
Other:
1.21 g
Protein:
6.86 g
Fats:
24.38 g
Carbs:
62.85 g
Water:
4.47 g
Other:
1.44 g
| Contains more WaterWater | +56.4% |
| Contains more ProteinProtein | +79.6% |
| Contains more FatsFats | +19.4% |
| Contains more OtherOther | +19% |
~equal in
Carbs
~62.85g
Fat Type Comparison
Fat type breakdown side-by-side comparison
Saturated fat:
Sat. Fat
13.814 g
Monounsaturated fat:
Mono. Fat
0 g
Polyunsaturated fat:
Poly. Fat
0 g
Saturated fat:
Sat. Fat
12.703 g
Monounsaturated fat:
Mono. Fat
0 g
Polyunsaturated fat:
Poly. Fat
0 g
~equal in
Saturated fat
~12.703g
~equal in
Monounsaturated fat
~g
~equal in
Polyunsaturated fat
~g