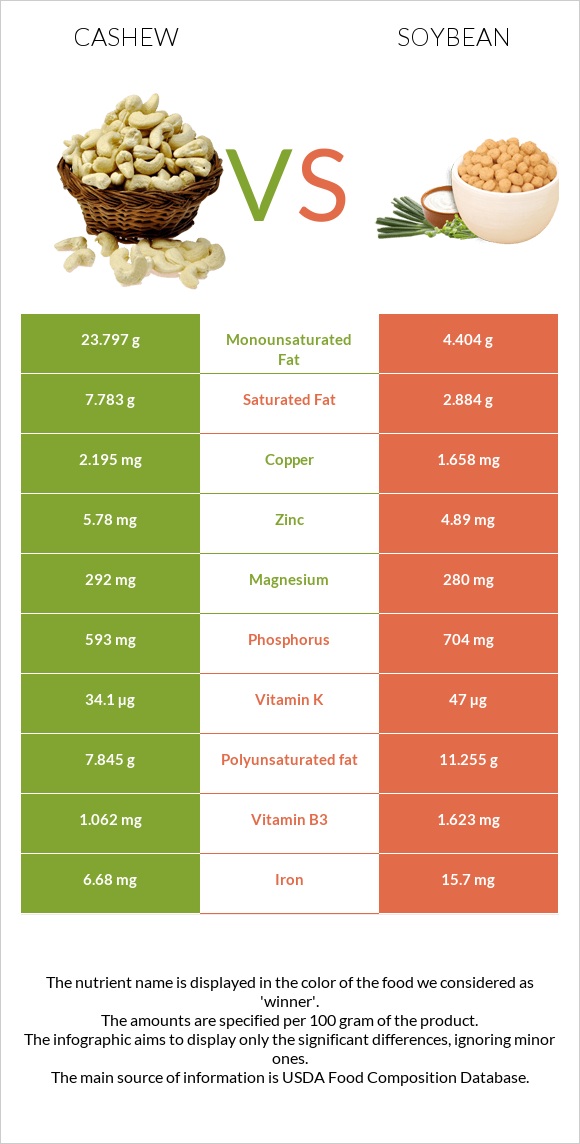
What are the main differences between cashew and soybeans? Cashew is richer in copper, phosphorus, magnesium, zinc, manganese, selenium, vitamin B1, and iron, while soybeans are higher in vitamin B2. Cashew's daily need coverage for copper is 199% higher. Soybeans have 6 times less saturated fat than cashew. Cashew has 7.783g of saturated fat, while soybeans have 1.297g. Cashew has a higher glycemic index (25) than soybeans (14). We used Nuts, cashew nuts, raw and Soybeans, mature cooked, boiled, without salt types in this comparison.
Infographic
Mineral Comparison
Mineral comparison score is based on the number of minerals by which one or the other food is richer. The "coverage" charts below show how much of the daily needs can be covered by 300 grams of the food.
8
100 g
300 g
1 oz - 28.35g
Magnesium
Magnesium
Calcium
Calcium
Potassium
Potassium
Iron
Iron
Copper
Copper
Zinc
Zinc
Phosphorus
Phosphorus
Sodium
Sodium
Manganese
Manganese
Selenium
Selenium
209%
11%
58%
251%
732%
158%
254%
1.6%
216%
109%
2
100 g
300 g
1 tbsp - 10.7g 1 cup - 172g
Magnesium
Magnesium
Calcium
Calcium
Potassium
Potassium
Iron
Iron
Copper
Copper
Zinc
Zinc
Phosphorus
Phosphorus
Sodium
Sodium
Manganese
Manganese
Selenium
Selenium
61%
31%
45%
193%
136%
31%
105%
0.13%
107%
40%
Vitamin Comparison
Vitamin comparison score is based on the number of vitamins by which one or the other food is richer. The "coverage" charts below show how much of the daily needs can be covered by 300 grams of the food.
6
100 g
300 g
1 oz - 28.35g
Vitamin C
Vit. C
Vitamin D
Vit. D
Vitamin A
Vit. A
Vitamin E
Vit. E
Vitamin B1
Vit. B1
Vitamin B2
Vit. B2
Vitamin B3
Vit. B3
Vitamin B5
Vit. B5
Vitamin B6
Vit. B6
Vitamin B12
Vit. B12
Vitamin K
Vit. K
Folate
Folate
1.7%
0%
0%
18%
106%
13%
20%
52%
96%
0%
85%
19%
3
100 g
300 g
1 tbsp - 10.7g 1 cup - 172g
Vitamin C
Vit. C
Vitamin D
Vit. D
Vitamin A
Vit. A
Vitamin E
Vit. E
Vitamin B1
Vit. B1
Vitamin B2
Vit. B2
Vitamin B3
Vit. B3
Vitamin B5
Vit. B5
Vitamin B6
Vit. B6
Vitamin B12
Vit. B12
Vitamin K
Vit. K
Folate
Folate
5.7%
0%
0%
7%
39%
66%
7.5%
11%
54%
0%
48%
41%
All nutrients comparison - raw data values
Nutrient
DV% diff.
Copper
2.195mg
0.407mg
199%
Monounsaturated fat
23.797g
1.981g
55%
Fats
43.85g
8.97g
54%
Phosphorus
593mg
245mg
50%
Magnesium
292mg
86mg
49%
Zinc
5.78mg
1.15mg
42%
Manganese
1.655mg
0.824mg
36%
Saturated fat
7.783g
1.297g
29%
Selenium
19.9µg
7.3µg
23%
Vitamin B1
0.423mg
0.155mg
22%
Calories
553kcal
172kcal
19%
Iron
6.68mg
5.14mg
19%
Polyunsaturated fat
7.845g
5.064g
19%
Vitamin B2
0.058mg
0.285mg
17%
Vitamin B5
0.864mg
0.179mg
14%
Vitamin B6
0.417mg
0.234mg
14%
Vitamin K
34.1µg
19.2µg
12%
Fiber
3.3g
6g
11%
Starch
23.49g
10%
Choline
47.5mg
9%
Carbs
30.19g
8.36g
7%
Calcium
37mg
102mg
7%
Folate
25µg
54µg
7%
Potassium
660mg
515mg
4%
Vitamin E
0.9mg
0.35mg
4%
Vitamin B3
1.062mg
0.399mg
4%
Vitamin C
0.5mg
1.7mg
1%
Protein
18.22g
18.21g
0%
Protein per 100 calories
3.3g
11g
N/A
Calories per 10 g protein
304kcal
94kcal
N/A
Weight per 100 calories
18g
58g
N/A
Unsaturated / Saturated Fat ratio
4.1
5.4
N/A
Net carbs
26.89g
2.36g
N/A
Sugar
5.91g
3g
N/A
Sodium
12mg
1mg
0%
Tryptophan
0.287mg
0.242mg
0%
Threonine
0.688mg
0.723mg
0%
Isoleucine
0.789mg
0.807mg
0%
Leucine
1.472mg
1.355mg
0%
Lysine
0.928mg
1.108mg
0%
Methionine
0.362mg
0.224mg
0%
Phenylalanine
0.951mg
0.869mg
0%
Valine
1.094mg
0.831mg
0%
Histidine
0.456mg
0.449mg
0%
Fructose
0.05g
0%
Macronutrient Comparison
Macronutrient breakdown side-by-side comparison
4
18%
44%
30%
5%
3%
Protein:
18.22 g
Fats:
43.85 g
Carbs:
30.19 g
Water:
5.2 g
Other:
2.54 g
1
18%
9%
8%
63%
2%
Protein:
18.21 g
Fats:
8.97 g
Carbs:
8.36 g
Water:
62.55 g
Other:
1.91 g
Contains
more
Fats Fats
+388.9%
Contains
more
Carbs Carbs
+261.1%
Contains
more
Other Other
+33%
Contains
more
Water Water
+1102.9%
~equal in
Protein
~18.21g
Fat Type Comparison
Fat type breakdown side-by-side comparison
2
20%
60%
20%
Saturated fat:
Sat. Fat
7.783 g
Monounsaturated fat:
Mono. Fat
23.797 g
Polyunsaturated fat:
Poly. Fat
7.845 g
1
16%
24%
61%
Saturated fat:
Sat. Fat
1.297 g
Monounsaturated fat:
Mono. Fat
1.981 g
Polyunsaturated fat:
Poly. Fat
5.064 g
Contains
more
Mono. Fat Monounsaturated fat
+1101.3%
Contains
more
Poly. Fat Polyunsaturated fat
+54.9%
Contains
less
Sat. Fat Saturated fat
-83.3%