Cranberry juice, unsweetened vs. Cranberries — In-Depth Nutrition Comparison
Compare
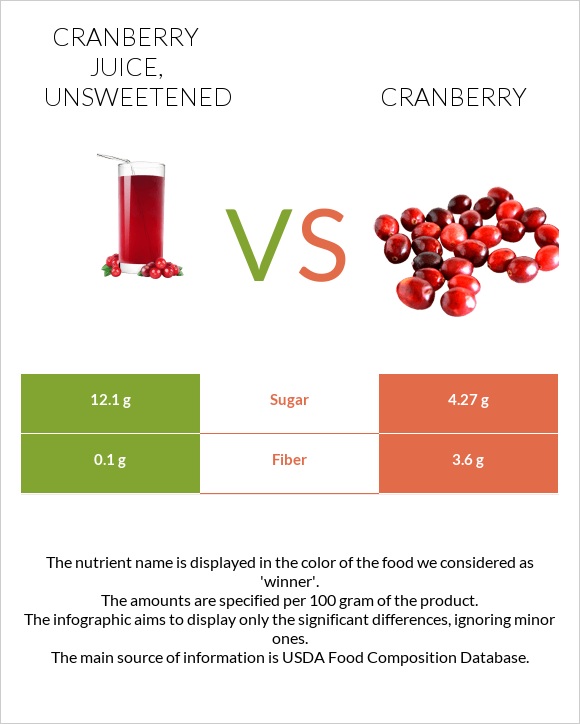
Significant differences between cranberry juice, unsweetened and cranberries
- The amount of fiber and vitamin C in cranberries is higher than in cranberry juice, unsweetened.
- Cranberries cover your daily fiber needs 14% more than cranberry juice, unsweetened.
- Cranberries have 3 times less sugar than cranberry juice, unsweetened. Cranberry juice, unsweetened has 12.1g of sugar, while cranberries have 4.27g.
Specific food types used in this comparison are Cranberry juice, unsweetened and Cranberries, raw.
Infographic
Infographic link
Mineral Comparison
Mineral comparison score is based on the number of minerals by which one or the other food is richer. The "coverage" charts below show how much of the daily needs can be covered by 300 grams of the food.
Vitamin Comparison
Vitamin comparison score is based on the number of vitamins by which one or the other food is richer. The "coverage" charts below show how much of the daily needs can be covered by 300 grams of the food.
| Contains more Vitamin CVitamin C | +50.5% |
| Contains more Vitamin AVitamin A | +50% |
| Contains more Vitamin B1Vitamin B1 | +33.3% |
| Contains more Vitamin B2Vitamin B2 | +11.1% |
| Contains more Vitamin B3Vitamin B3 | +11% |
| Contains more CholineCholine | +66.7% |
All nutrients comparison - raw data values
| Nutrient |  |
 |
DV% diff. |
| Fiber | 0.1g | 3.6g | 14% |
| Manganese | 0.267mg | 12% | |
| Vitamin B5 | 0.295mg | 6% | |
| Vitamin C | 9.3mg | 14mg | 5% |
| Fructose | 0.67g | 1% | |
| Vitamin E | 1.2mg | 1.32mg | 1% |
| Calories | 46kcal | 46kcal | 0% |
| Protein | 0.39g | 0.46g | 0% |
| Fats | 0.13g | 0.13g | 0% |
| Carbs | 12.2g | 11.97g | 0% |
| Net carbs | 12.1g | 8.37g | N/A |
| Magnesium | 6mg | 6mg | 0% |
| Calcium | 8mg | 8mg | 0% |
| Potassium | 77mg | 80mg | 0% |
| Iron | 0.25mg | 0.23mg | 0% |
| Sugar | 12.1g | 4.27g | N/A |
| Copper | 0.055mg | 0.056mg | 0% |
| Zinc | 0.1mg | 0.09mg | 0% |
| Phosphorus | 13mg | 11mg | 0% |
| Sodium | 2mg | 2mg | 0% |
| Vitamin A | 2µg | 3µg | 0% |
| Selenium | 0.1µg | 0.1µg | 0% |
| Vitamin B1 | 0.009mg | 0.012mg | 0% |
| Vitamin B2 | 0.018mg | 0.02mg | 0% |
| Vitamin B3 | 0.091mg | 0.101mg | 0% |
| Vitamin B6 | 0.052mg | 0.057mg | 0% |
| Vitamin K | 5.1µg | 5µg | 0% |
| Folate | 1µg | 1µg | 0% |
| Choline | 3.3mg | 5.5mg | 0% |
| Saturated fat | 0.01g | 0.008g | 0% |
| Monounsaturated fat | 0.023g | 0.018g | 0% |
| Polyunsaturated fat | 0.07g | 0.055g | 0% |
| Tryptophan | 0.003mg | 0% | |
| Threonine | 0.028mg | 0% | |
| Isoleucine | 0.033mg | 0% | |
| Leucine | 0.053mg | 0% | |
| Lysine | 0.039mg | 0% | |
| Methionine | 0.003mg | 0% | |
| Phenylalanine | 0.036mg | 0% | |
| Valine | 0.045mg | 0% | |
| Histidine | 0.018mg | 0% |
Macronutrient Comparison
Macronutrient breakdown side-by-side comparison
Protein:
0.39 g
Fats:
0.13 g
Carbs:
12.2 g
Water:
87.13 g
Other:
0.15 g
Protein:
0.46 g
Fats:
0.13 g
Carbs:
11.97 g
Water:
87.32 g
Other:
0.12 g
| Contains more OtherOther | +25% |
| Contains more ProteinProtein | +17.9% |
~equal in
Fats
~0.13g
~equal in
Carbs
~11.97g
~equal in
Water
~87.32g
Fat Type Comparison
Fat type breakdown side-by-side comparison
Saturated fat:
Sat. Fat
0.01 g
Monounsaturated fat:
Mono. Fat
0.023 g
Polyunsaturated fat:
Poly. Fat
0.07 g
Saturated fat:
Sat. Fat
0.008 g
Monounsaturated fat:
Mono. Fat
0.018 g
Polyunsaturated fat:
Poly. Fat
0.055 g
| Contains more Mono. FatMonounsaturated fat | +27.8% |
| Contains more Poly. FatPolyunsaturated fat | +27.3% |
| Contains less Sat. FatSaturated fat | -20% |