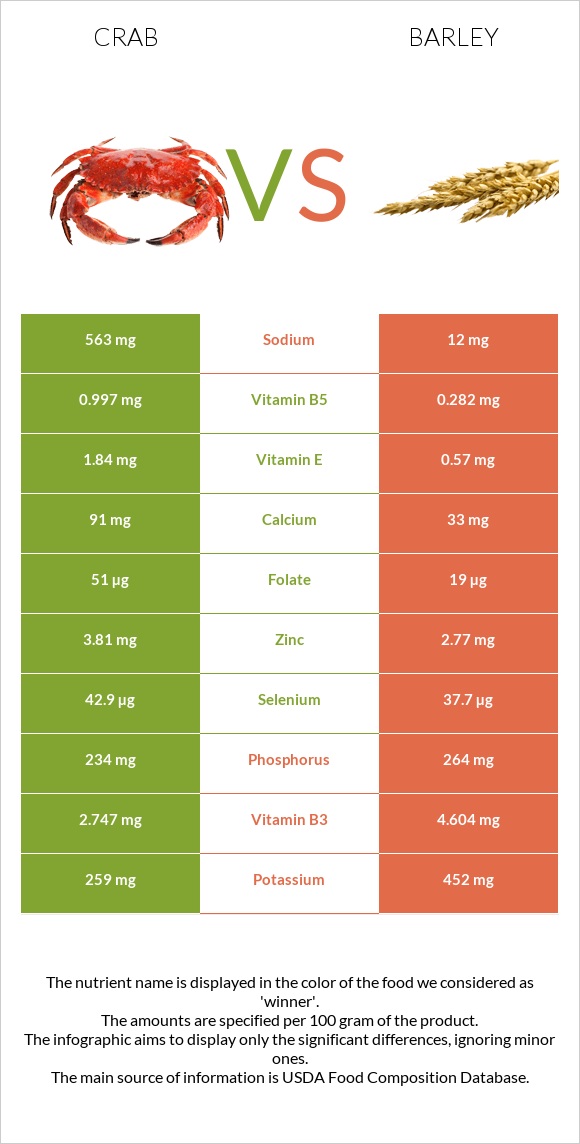
A recap on the differences between crab and barley Crab has more vitamin B12 and copper; however, barley is higher in manganese, fiber, vitamin B1, iron, magnesium, and vitamin B2. Crab covers your daily vitamin B12 needs 139% more than barley. The glycemic index of barley is higher. Food varieties used in this article are Crustaceans, crab, blue, canned and Barley, hulled .
Infographic
Mineral Comparison
Mineral comparison score is based on the number of minerals by which one or the other food is richer. The "coverage" charts below show how much of the daily needs can be covered by 300 grams of the food.
4
100 g
300 g
1 oz - 28.35g 3 oz - 85g 1 can (6.5 oz), drained - 125g 1 cup - 135g
Magnesium
Magnesium
Calcium
Calcium
Potassium
Potassium
Iron
Iron
Copper
Copper
Zinc
Zinc
Phosphorus
Phosphorus
Sodium
Sodium
Manganese
Manganese
Selenium
Selenium
26%
27%
23%
19%
271%
104%
100%
73%
9.7%
234%
6
100 g
300 g
1 cup - 184g
Magnesium
Magnesium
Calcium
Calcium
Potassium
Potassium
Iron
Iron
Copper
Copper
Zinc
Zinc
Phosphorus
Phosphorus
Sodium
Sodium
Manganese
Manganese
Selenium
Selenium
95%
9.9%
40%
135%
166%
76%
113%
1.6%
253%
206%
Vitamin Comparison
Vitamin comparison score is based on the number of vitamins by which one or the other food is richer. The "coverage" charts below show how much of the daily needs can be covered by 300 grams of the food.
5
100 g
300 g
1 oz - 28.35g 3 oz - 85g 1 can (6.5 oz), drained - 125g 1 cup - 135g
Vitamin C
Vit. C
Vitamin D
Vit. D
Vitamin A
Vit. A
Vitamin E
Vit. E
Vitamin B1
Vit. B1
Vitamin B2
Vit. B2
Vitamin B3
Vit. B3
Vitamin B5
Vit. B5
Vitamin B6
Vit. B6
Vitamin B12
Vit. B12
Vitamin K
Vit. K
Folate
Folate
11%
0%
0.33%
37%
5.8%
21%
52%
60%
36%
416%
0.75%
38%
5
100 g
300 g
1 cup - 184g
Vitamin C
Vit. C
Vitamin D
Vit. D
Vitamin A
Vit. A
Vitamin E
Vit. E
Vitamin B1
Vit. B1
Vitamin B2
Vit. B2
Vitamin B3
Vit. B3
Vitamin B5
Vit. B5
Vitamin B6
Vit. B6
Vitamin B12
Vit. B12
Vitamin K
Vit. K
Folate
Folate
0%
0%
0.33%
11%
162%
66%
86%
17%
73%
0%
5.5%
14%
All nutrients comparison - raw data values
Nutrient
DV% diff.
Vitamin B12
3.33µg
0µg
139%
Manganese
0.074mg
1.943mg
81%
Fiber
0g
17.3g
69%
Vitamin B1
0.023mg
0.646mg
52%
Iron
0.5mg
3.6mg
39%
Copper
0.814mg
0.498mg
35%
Cholesterol
97mg
0mg
32%
Carbs
0g
73.48g
24%
Sodium
563mg
12mg
24%
Magnesium
36mg
133mg
23%
Vitamin B2
0.093mg
0.285mg
15%
Choline
80.9mg
15%
Calories
83kcal
354kcal
14%
Vitamin B5
0.997mg
0.282mg
14%
Vitamin B3
2.747mg
4.604mg
12%
Vitamin B6
0.156mg
0.318mg
12%
Protein
17.88g
12.48g
11%
Zinc
3.81mg
2.77mg
9%
Selenium
42.9µg
37.7µg
9%
Vitamin E
1.84mg
0.57mg
8%
Folate
51µg
19µg
8%
Calcium
91mg
33mg
6%
Potassium
259mg
452mg
6%
Polyunsaturated fat
0.258g
1.108g
6%
Vitamin C
3.3mg
0mg
4%
Phosphorus
234mg
264mg
4%
Fats
0.74g
2.3g
2%
Vitamin K
0.3µg
2.2µg
2%
Saturated fat
0.201g
0.482g
1%
Protein per 100 calories
22g
3.5g
N/A
Calories per 10 g protein
46kcal
284kcal
N/A
Weight per 100 calories
120g
28g
N/A
Unsaturated / Saturated Fat ratio
1.9
2.9
N/A
Net carbs
0g
56.18g
N/A
Sugar
0g
0.8g
N/A
Vitamin A
1µg
1µg
0%
Trans fat
0.014g
N/A
Monounsaturated fat
0.129g
0.295g
0%
Tryptophan
0.226mg
0.208mg
0%
Threonine
0.727mg
0.424mg
0%
Isoleucine
0.776mg
0.456mg
0%
Leucine
1.307mg
0.848mg
0%
Lysine
1.386mg
0.465mg
0%
Methionine
0.452mg
0.24mg
0%
Phenylalanine
0.708mg
0.7mg
0%
Valine
0.806mg
0.612mg
0%
Histidine
0.393mg
0.281mg
0%
Omega-3 - EPA
0.101g
0g
N/A
Omega-3 - DHA
0.067g
0g
N/A
Omega-3 - DPA
0.009g
0g
N/A
Omega-6 - Eicosadienoic acid
0.005g
N/A
Macronutrient Comparison
Macronutrient breakdown side-by-side comparison
2
18%
80%
2%
Protein:
17.88 g
Fats:
0.74 g
Carbs:
0 g
Water:
79.69 g
Other:
1.69 g
3
12%
2%
73%
9%
2%
Protein:
12.48 g
Fats:
2.3 g
Carbs:
73.48 g
Water:
9.44 g
Other:
2.3 g
Contains
more
Protein Protein
+43.3%
Contains
more
Water Water
+744.2%
Contains
more
Fats Fats
+210.8%
Contains
more
Carbs Carbs
+∞%
Contains
more
Other Other
+36.1%
Fat Type Comparison
Fat type breakdown side-by-side comparison
1
34%
22%
44%
Saturated fat:
Sat. Fat
0.201 g
Monounsaturated fat:
Mono. Fat
0.129 g
Polyunsaturated fat:
Poly. Fat
0.258 g
2
26%
16%
59%
Saturated fat:
Sat. Fat
0.482 g
Monounsaturated fat:
Mono. Fat
0.295 g
Polyunsaturated fat:
Poly. Fat
1.108 g
Contains
less
Sat. Fat Saturated fat
-58.3%
Contains
more
Mono. Fat Monounsaturated fat
+128.7%
Contains
more
Poly. Fat Polyunsaturated fat
+329.5%