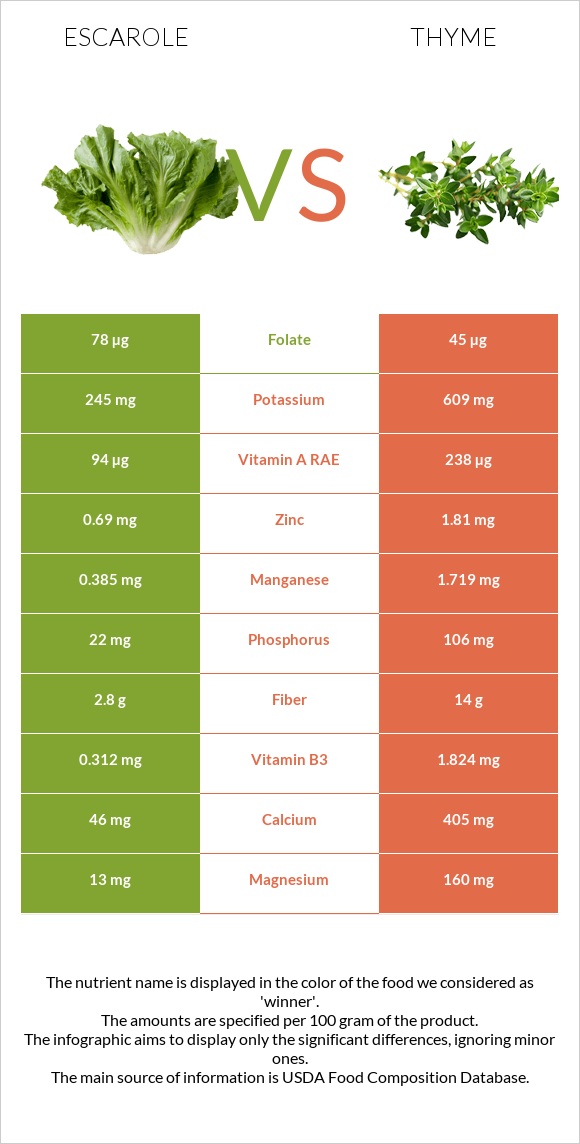
Summary of differences between escarole and thyme Escarole has less iron, vitamin C, manganese, vitamin A, copper, fiber, calcium, magnesium, vitamin B2, and vitamin B6 than thyme. Thyme covers your daily need for iron, 209% more than escarole. The glycemic index of thyme is higher. These are the specific foods used in this comparison Escarole, cooked, boiled, drained, no salt added and Thyme, fresh .
Infographic
Mineral Comparison
Mineral comparison score is based on the number of minerals by which one or the other food is richer. The "coverage" charts below show how much of the daily needs can be covered by 300 grams of the food.
1
100 g
300 g
1 cup - 150g
Magnesium
Magnesium
Calcium
Calcium
Potassium
Potassium
Iron
Iron
Copper
Copper
Zinc
Zinc
Phosphorus
Phosphorus
Sodium
Sodium
Manganese
Manganese
Selenium
Selenium
9.3%
14%
22%
27%
29%
19%
9.4%
2.5%
50%
1.1%
9
100 g
300 g
0.5 tsp - 0.4g 1 tsp - 0.8g
Magnesium
Magnesium
Calcium
Calcium
Potassium
Potassium
Iron
Iron
Copper
Copper
Zinc
Zinc
Phosphorus
Phosphorus
Sodium
Sodium
Manganese
Manganese
Selenium
Selenium
114%
122%
54%
654%
185%
49%
45%
1.2%
224%
0%
Vitamin Comparison
Vitamin comparison score is based on the number of vitamins by which one or the other food is richer. The "coverage" charts below show how much of the daily needs can be covered by 300 grams of the food.
5
100 g
300 g
1 cup - 150g
Vitamin C
Vit. C
Vitamin D
Vit. D
Vitamin A
Vit. A
Vitamin E
Vit. E
Vitamin B1
Vit. B1
Vitamin B2
Vit. B2
Vitamin B3
Vit. B3
Vitamin B5
Vit. B5
Vitamin B6
Vit. B6
Vitamin B12
Vit. B12
Vitamin K
Vit. K
Folate
Folate
11%
0%
31%
8%
15%
14%
5.9%
50%
3.7%
0%
530%
59%
5
100 g
300 g
0.5 tsp - 0.4g 1 tsp - 0.8g
Vitamin C
Vit. C
Vitamin D
Vit. D
Vitamin A
Vit. A
Vitamin E
Vit. E
Vitamin B1
Vit. B1
Vitamin B2
Vit. B2
Vitamin B3
Vit. B3
Vitamin B5
Vit. B5
Vitamin B6
Vit. B6
Vitamin B12
Vit. B12
Vitamin K
Vit. K
Folate
Folate
534%
0%
79%
0%
12%
109%
34%
25%
80%
0%
0%
34%
All nutrients comparison - raw data values
Nutrient
DV% diff.
Iron
0.72mg
17.45mg
209%
Vitamin K
211.9µg
177%
Vitamin C
3.3mg
160.1mg
174%
Manganese
0.385mg
1.719mg
58%
Copper
0.087mg
0.555mg
52%
Fiber
2.8g
14g
45%
Calcium
46mg
405mg
36%
Magnesium
13mg
160mg
35%
Vitamin B2
0.062mg
0.471mg
31%
Vitamin B6
0.016mg
0.348mg
26%
Vitamin A
94µg
238µg
16%
Phosphorus
22mg
106mg
12%
Potassium
245mg
609mg
11%
Zinc
0.69mg
1.81mg
10%
Protein
1.15g
5.56g
9%
Vitamin B3
0.312mg
1.824mg
9%
Vitamin B5
0.826mg
0.409mg
8%
Folate
78µg
45µg
8%
Carbs
3.07g
24.45g
7%
Calories
19kcal
101kcal
4%
Vitamin E
0.4mg
3%
Choline
15.4mg
3%
Polyunsaturated fat
0.081g
0.532g
3%
Fats
0.18g
1.68g
2%
Saturated fat
0.042g
0.467g
2%
Vitamin B1
0.059mg
0.048mg
1%
Protein per 100 calories
6.1g
5.5g
N/A
Calories per 10 g protein
165kcal
182kcal
N/A
Weight per 100 calories
526g
99g
N/A
Net carbs
0.27g
10.45g
N/A
Sugar
0.23g
N/A
Sodium
19mg
9mg
0%
Selenium
0.2µg
0%
Monounsaturated fat
0.004g
0.081g
0%
Tryptophan
0.005mg
0.114mg
0%
Threonine
0.046mg
0.154mg
0%
Isoleucine
0.066mg
0.285mg
0%
Leucine
0.09mg
0.262mg
0%
Lysine
0.058mg
0.126mg
0%
Methionine
0.013mg
0%
Phenylalanine
0.049mg
0%
Valine
0.058mg
0.307mg
0%
Histidine
0.021mg
0%
Macronutrient Comparison
Macronutrient breakdown side-by-side comparison
1
3%
94%
Protein:
1.15 g
Fats:
0.18 g
Carbs:
3.07 g
Water:
94.29 g
Other:
1.31 g
4
6%
2%
24%
65%
3%
Protein:
5.56 g
Fats:
1.68 g
Carbs:
24.45 g
Water:
65.11 g
Other:
3.2 g
Contains
more
Water Water
+44.8%
Contains
more
Protein Protein
+383.5%
Contains
more
Fats Fats
+833.3%
Contains
more
Carbs Carbs
+696.4%
Contains
more
Other Other
+144.3%
Fat Type Comparison
Fat type breakdown side-by-side comparison
1
33%
3%
64%
Saturated fat:
Sat. Fat
0.042 g
Monounsaturated fat:
Mono. Fat
0.004 g
Polyunsaturated fat:
Poly. Fat
0.081 g
2
43%
8%
49%
Saturated fat:
Sat. Fat
0.467 g
Monounsaturated fat:
Mono. Fat
0.081 g
Polyunsaturated fat:
Poly. Fat
0.532 g
Contains
less
Sat. Fat Saturated fat
-91%
Contains
more
Mono. Fat Monounsaturated fat
+1925%
Contains
more
Poly. Fat Polyunsaturated fat
+556.8%